
Price charts are the primary visual representation of any financial market and show exactly how a currency pair is moving at any given moment. A chart may look simple, especially basic line charts that are easy to read, yet behind that simplicity lies a large amount of valuable information for the trader who knows how to interpret it. Technical analysis is the key that unlocks this information, allowing forex traders to study past price behaviour, identify recurring formations, and forecast probable future direction.

These recurring formations are known as chart patterns, which are shapes created by price action on the chart. There are dozens of them, each carrying specific meaning: some signal trend continuation, others predict reversals, while certain patterns perform best in ranging markets and others during high volatility. The more patterns a trader masters, the better prepared he is for any market condition. Below are the most important and reliable forex chart patterns that continue to deliver results in 2026.
1. Head and Shoulders
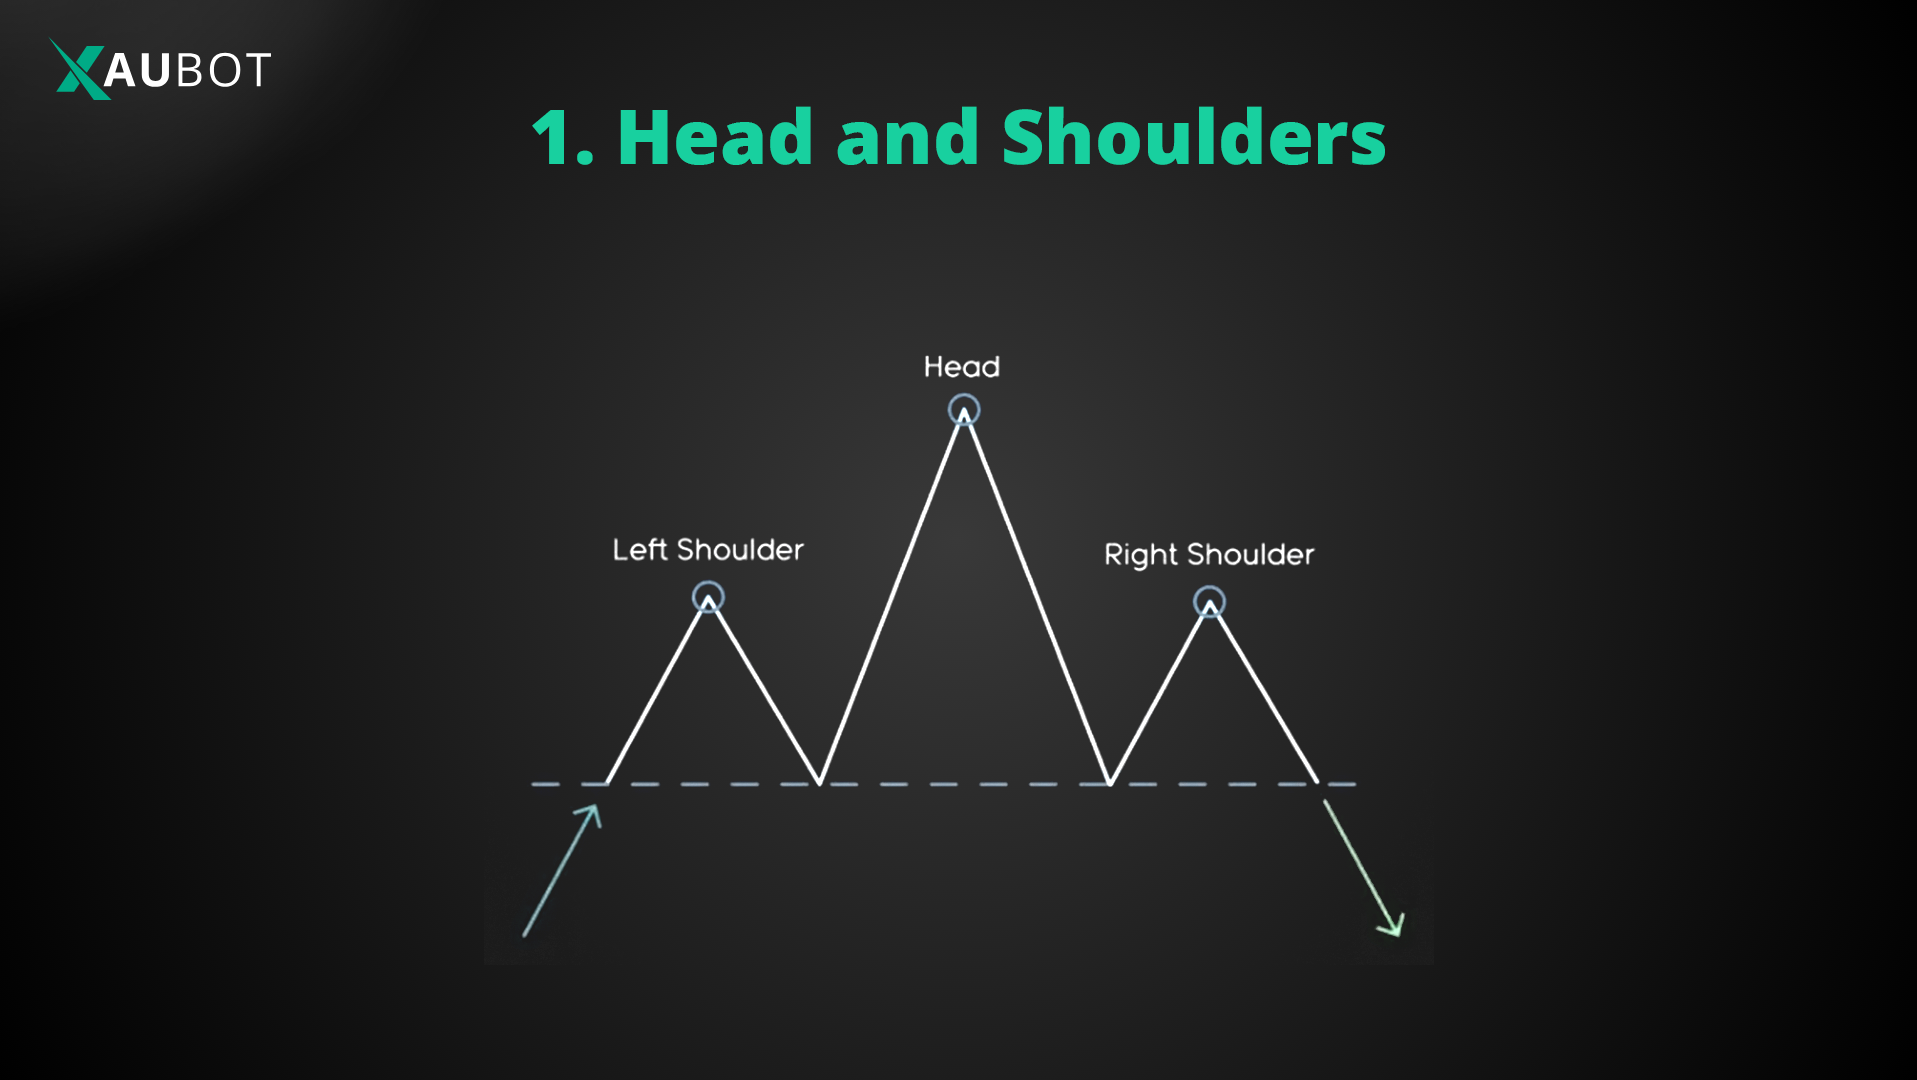
The head and shoulders chart pattern is one of the most reliable reversal formations in forex. It consists of three successive peaks: the left shoulder, a higher peak (the head), and then a lower peak (the right shoulder). A neckline is drawn by connecting the lows between these peaks, which usually forms a roughly horizontal support level.
This pattern signals the end of a bullish trend and the beginning of a bearish move. The reversal is confirmed when price closes below the neckline after forming the right shoulder. Once the breakout occurs, the market typically continues downward by a distance roughly equal to the height from the head to the neckline.
Traders often wait for the neckline break and a possible retest before entering short positions. In 2026 this classic pattern continues to appear frequently on major pairs and remains a high-probability setup for trend-reversal trades.
2. Symmetrical Triangle
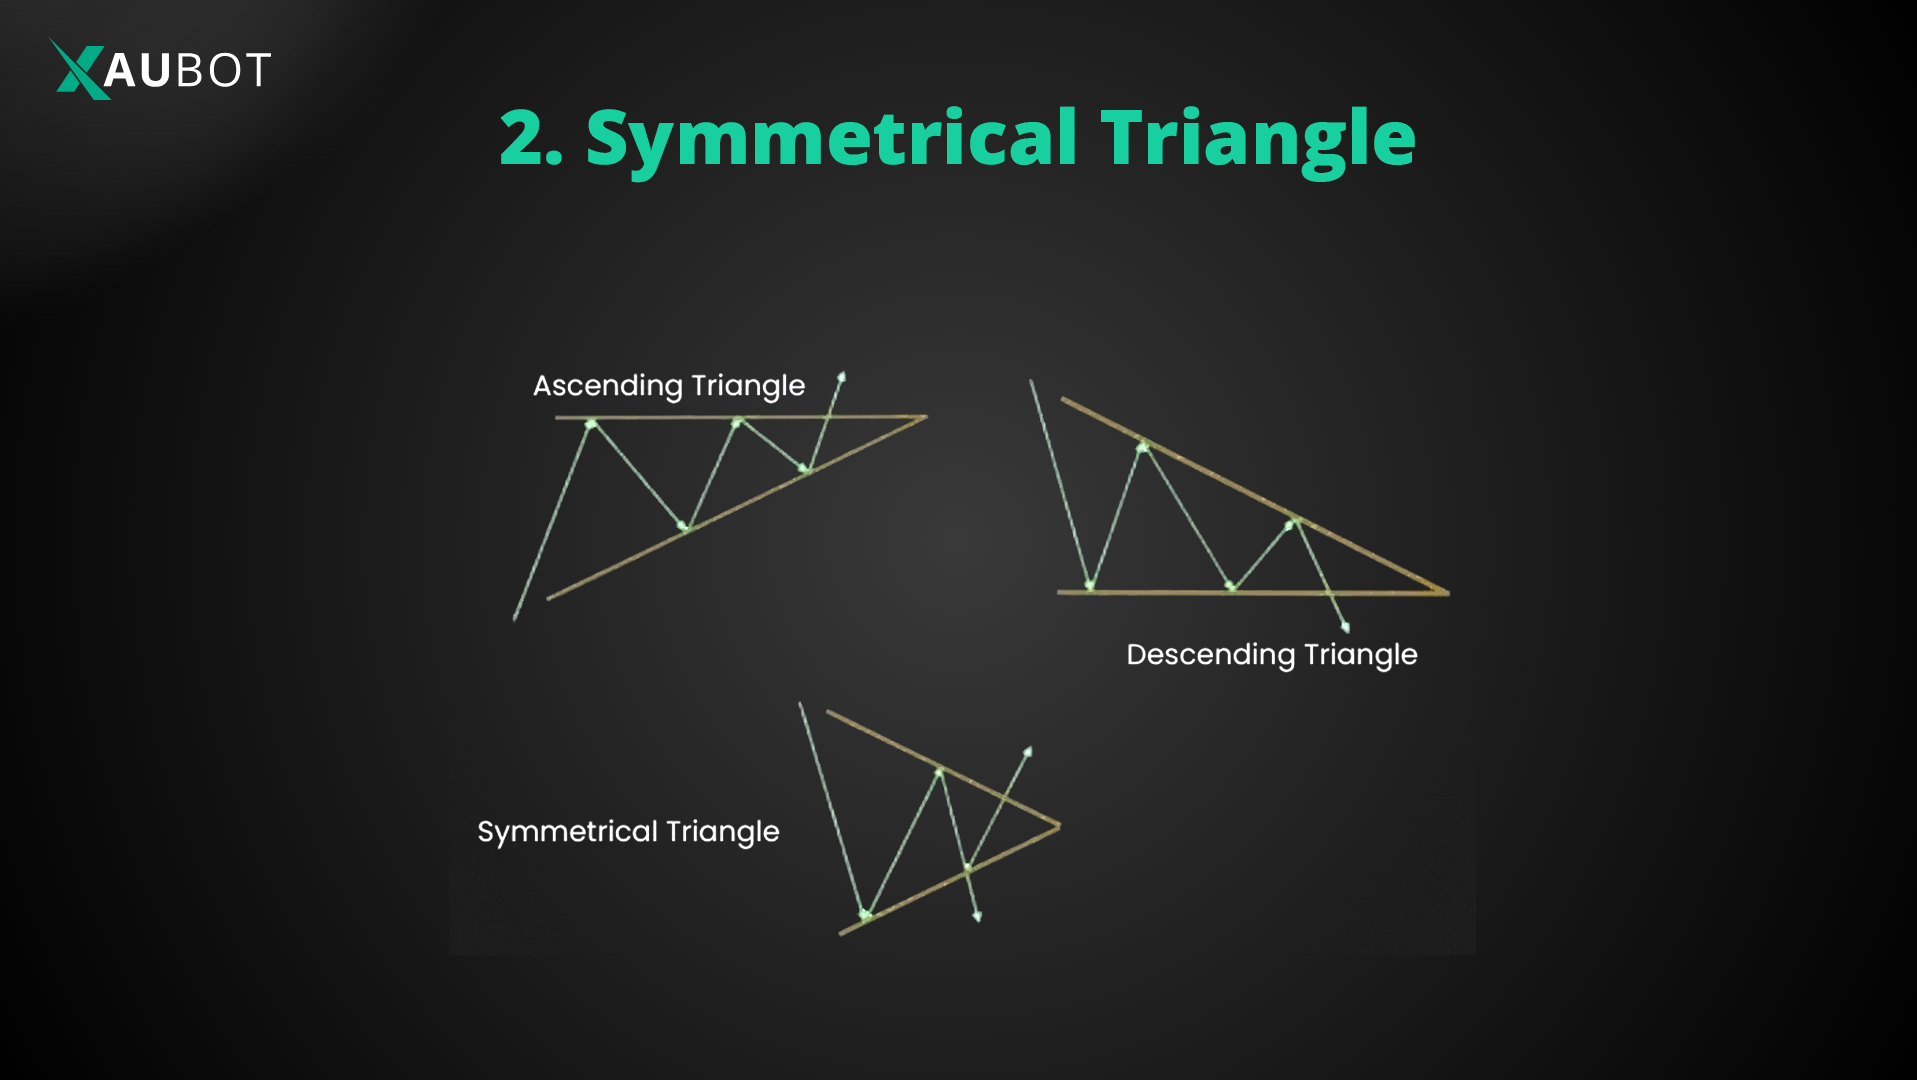
As the name suggests, a symmetrical triangle pattern forms between two symmetrical lines. There are two possible outcomes for the symmetrical triangle.
First, suppose the overall trend is bullish, so there is a line going upwards. If the line is met with a number of lows and yet highs at the same time a triangle will form which will then break so that the trend will continue in its previous direction. Thus another symmetrical line forms to the one that we talked about earlier, and between two of them we have the triangle. This is how a symmetrical triangle can signal the trend will continue in its previous trajectory, whether bearish or bullish.
However, a second situation is when there is no clear previous trajectory for the price movement and market momentum. In this case after the triangle is formed, the price could continue in either direction.
3. Ascending Triangle
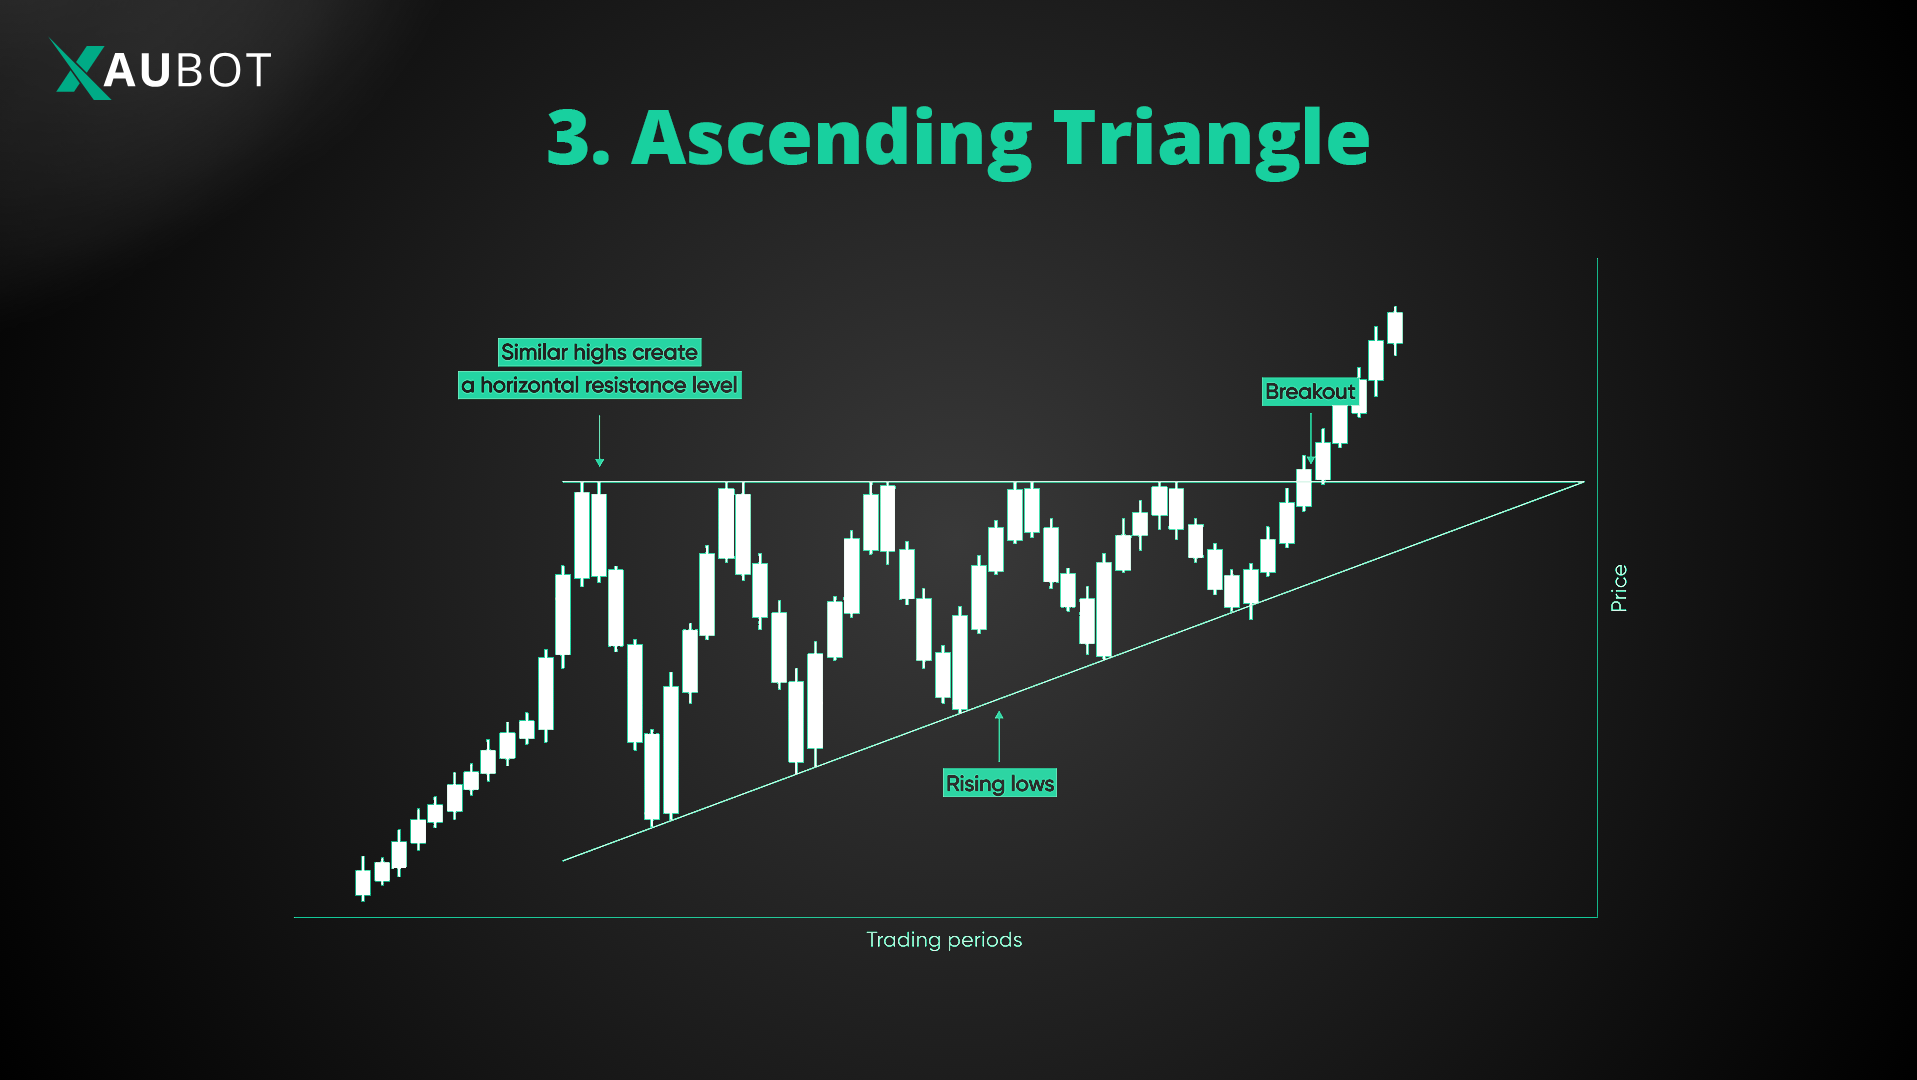
Of course the ascending triangle signals the continuation of the bullish trend or at least the confirmation that the trend will indeed be bullish. The way it works is that when we have a series of highs, we draw a line on all the high points which have not broken through a certain threshold, thus a horizontal line is formed – i.e. the resistance level.
From the bottom, we can draw a line between all the lows, which are moving higher and higher, thus the upcoming bullish trend. This is of course the support level. But because the trend is to be a bullish one, the support level is rising. Therefore, the resultant line would be rising.
Where these two lines, the horizontal resistance line and the rising support line meet each other or get close to one another the ascending triangle is formed.
4. Descending Triangle
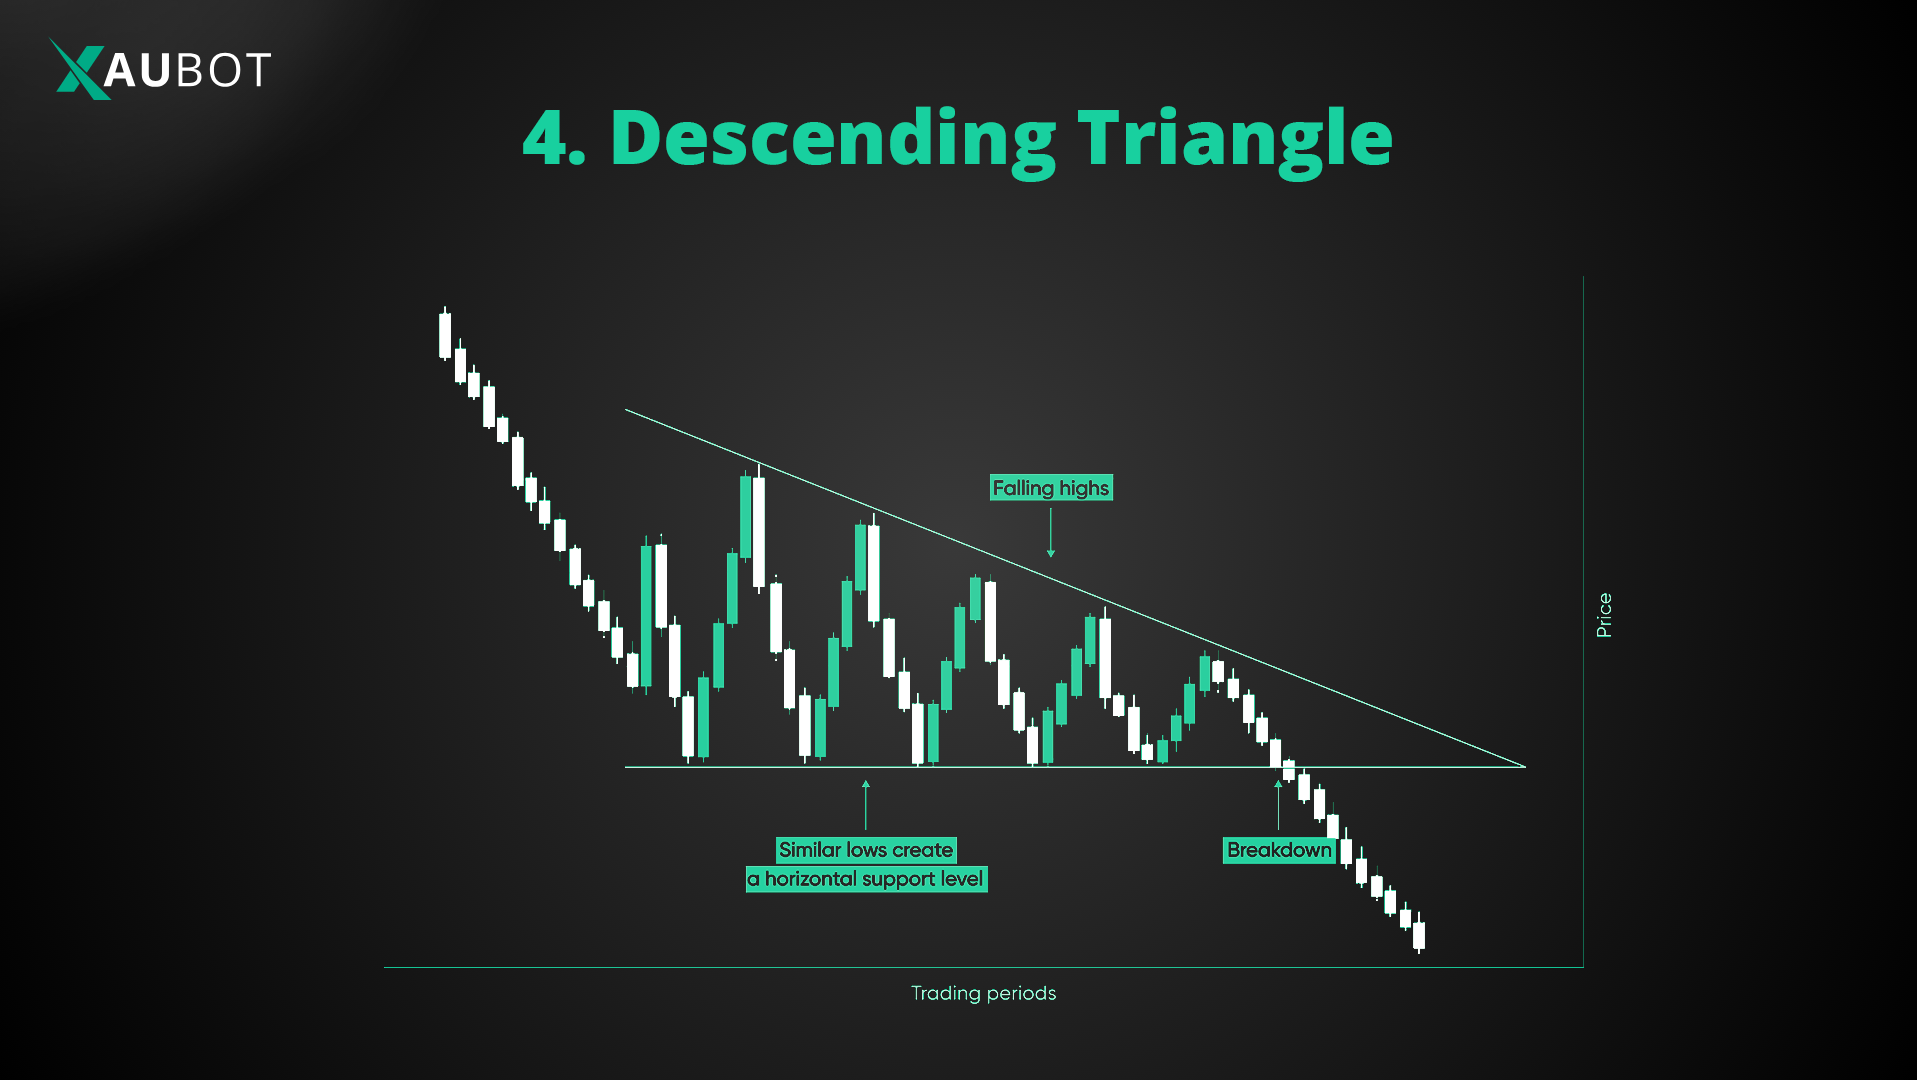
The opposite of an ascending triangle is the descending triangle. Naturally, a descending triangle is indicative of an upcoming bearish trend.
In this chart pattern, the horizontal side of the triangle is formed by the support levels. On the other hand, the descending side of the triangle is formed by the spots on the descending resistance level.
Where these two lines meet each other, a clear descending triangle is formed.
It is expected that following this triangle the prices will break out even further into a bearish trend. Thus forex traders would normally opt for a short position.
5. Triangular Flags
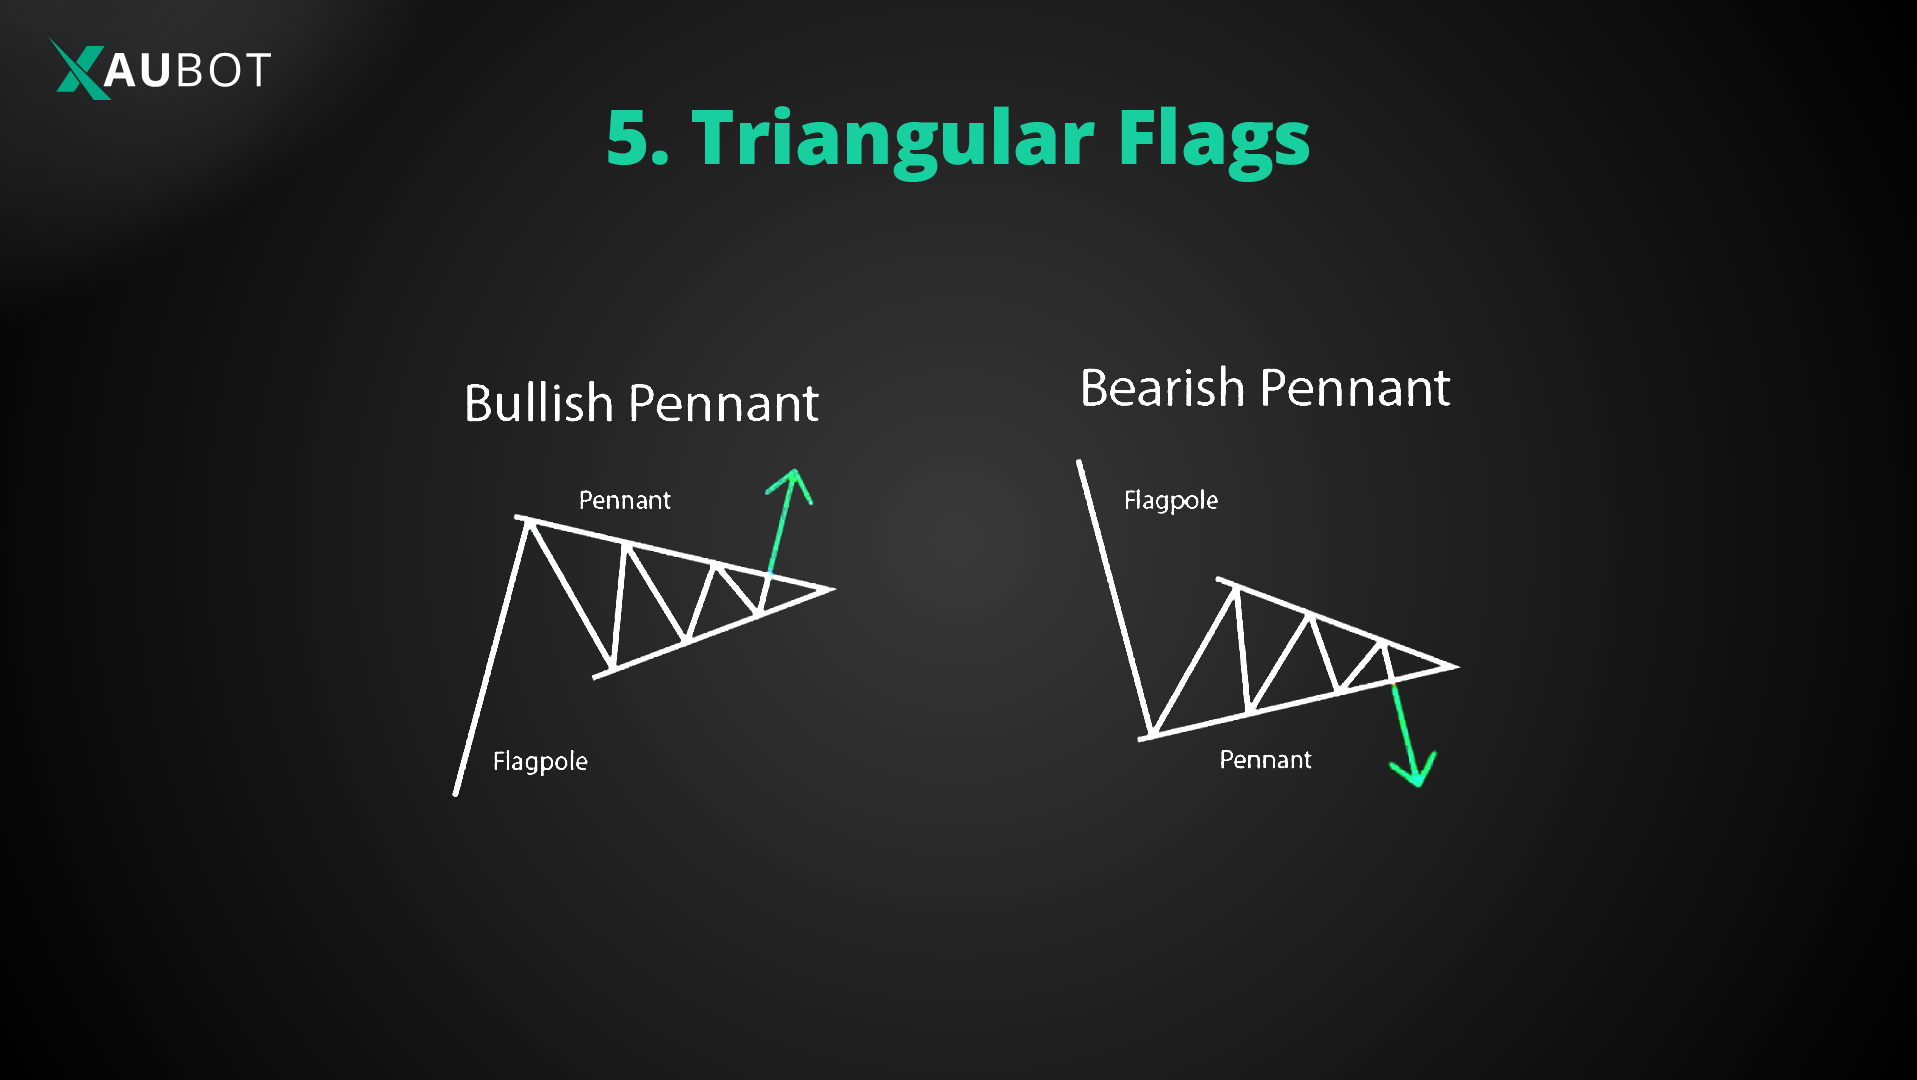
Flag chart patterns will require an initial move upward that would be a bit significant. Thus forming the base of the flag. After this rather substantial rise, the price will consolidate with smaller highs and lows. Therefore, the rest of the flag is shaped.
As it can clearly be surmised the resultant flag has a triangular shape. This is why these chart patterns are also known as pennants.
Pennants can signal both bullish and bearish trends.
6. Cup and Handle
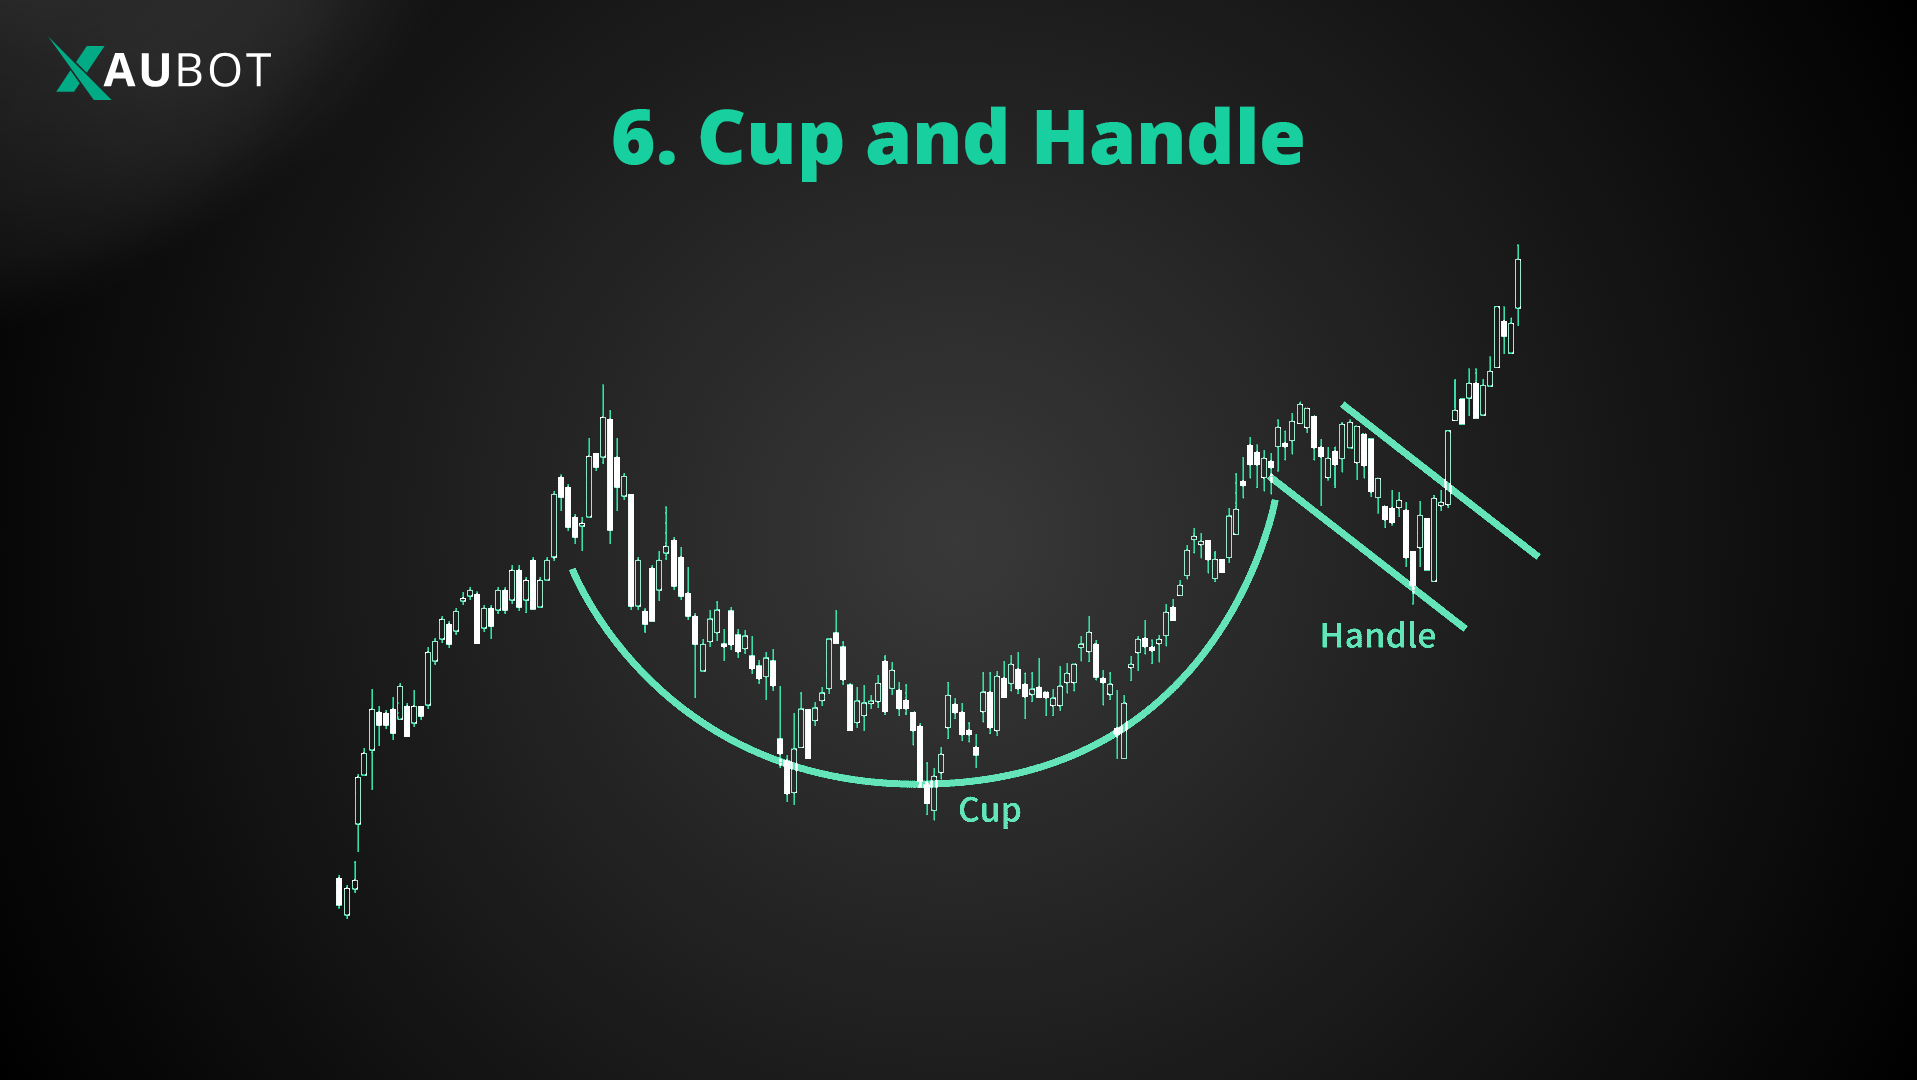
The cup and handle chart pattern will indicate to forex traders that the bullish trend will continue. It is basically a small and smooth bearish retracement, after which the bullish trend will resume its upward trend.
In order for this pattern to form, first the cup itself needs to form. Which starts by prices dipping below, then plateauing to a certain extent and then moving upwards again, thus forming the round bottom of the cup.
After that we will see some smaller lows, which will form the handle of the cup. The handle would form two rather parallel lines consisting of the support and resistance levels. After the handle is formed, the bullish trend will pick up again like before.
7. Wedges
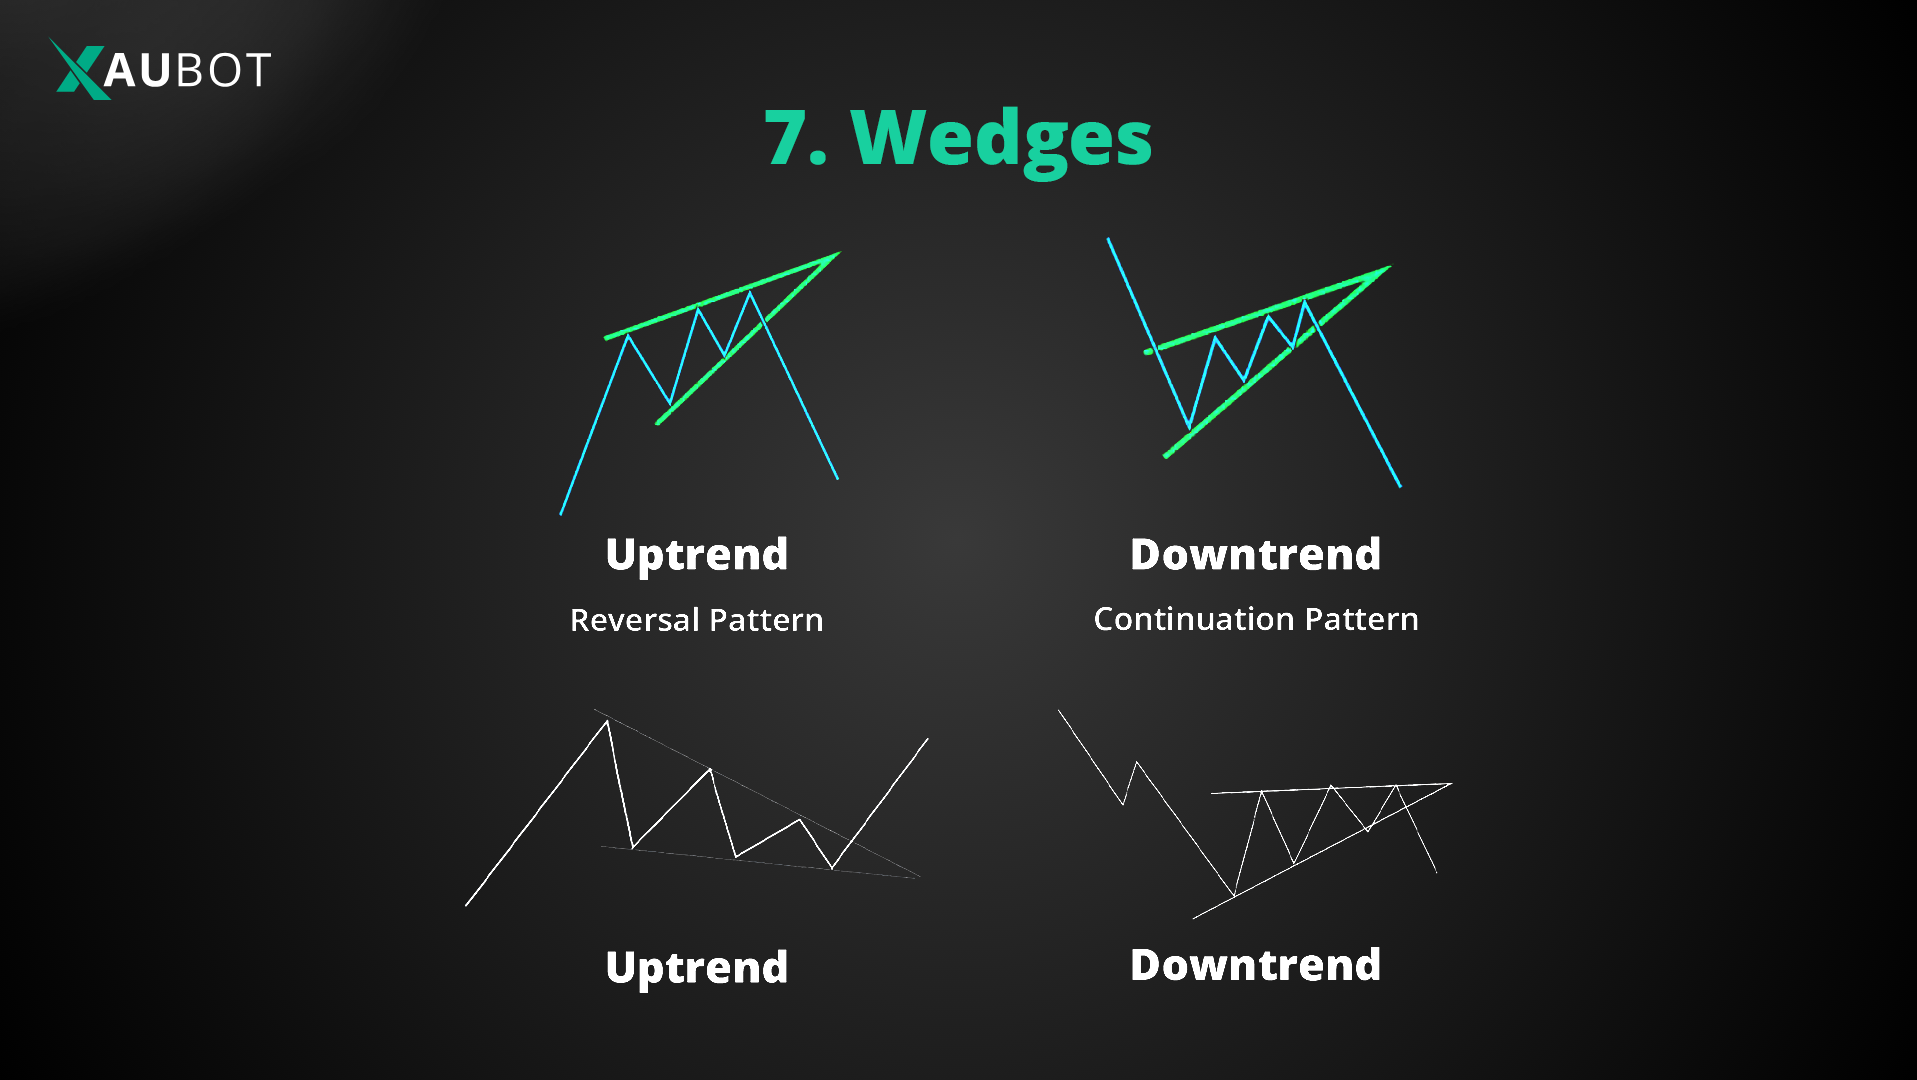
A wedge pattern is formed when two lines of support and resistance tighten along the same trajectory.
Clearly, this would mean that wedges are either upward and downward in their trajectory.
An upward wedge is formed by steadily rising support and resistance levels. On the contrary, this indicates the prices will fall straight down to a bearish trend soon.
A downward wedge is formed by steadily falling support and resistance levels. Downward wedge pattern is indicative of an upcoming bullish trend.
8. Double Top

The double top pattern is very similar to the head and shoulders pattern without the head. In this case we have two tops or highs, similar to the two shoulders discussed above. Between these two double tops, the price would fall back to the support level. However, after the second top, the prices will fall much further down toward the bearish area.
A double tap pattern is generally used to indicate a reversal in trend.
9. Double Bottom
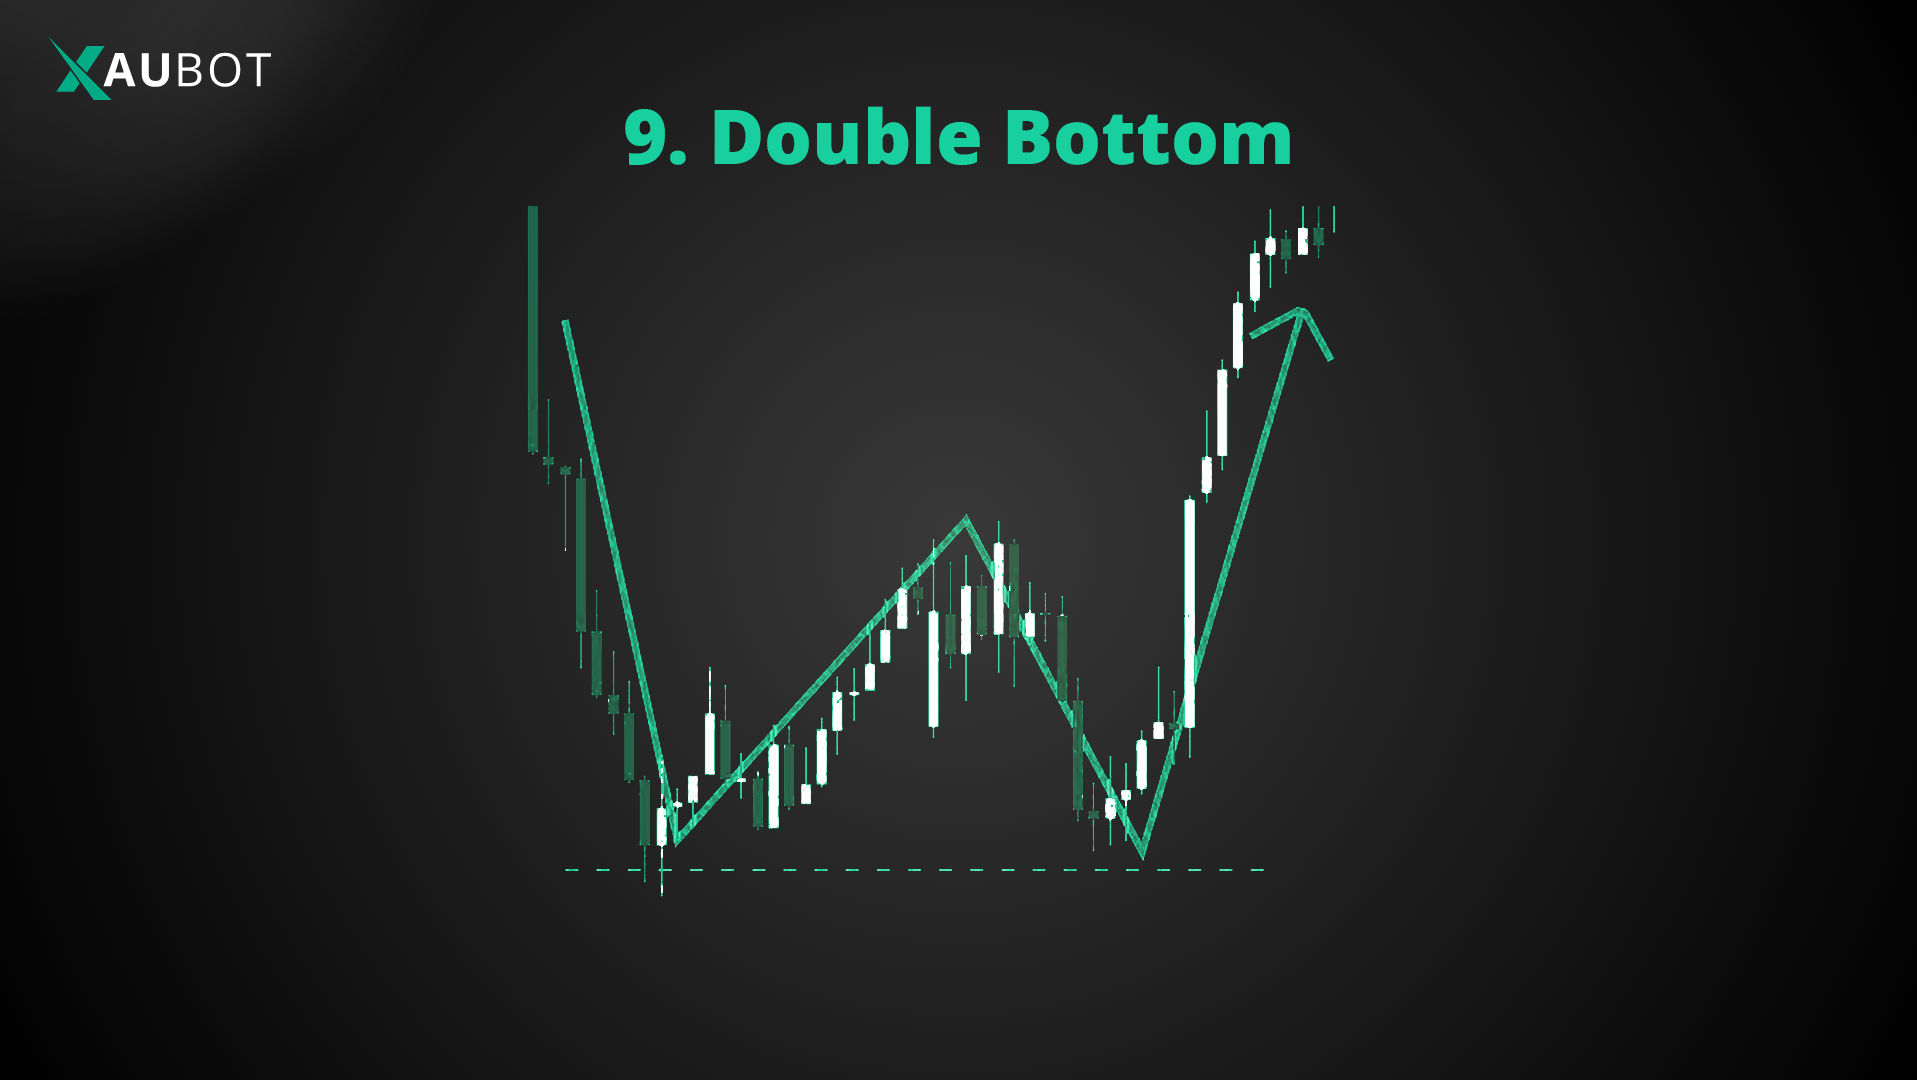
The opposite of a double top is of course the double bottom which is indicative of a bullish reversal.
In this case we have two bottom points or lows which fall back to the resistance level. After the second low, the trend would break through the resistance level and move toward the bullish area again.
10. Triple Top and Triple Bottom
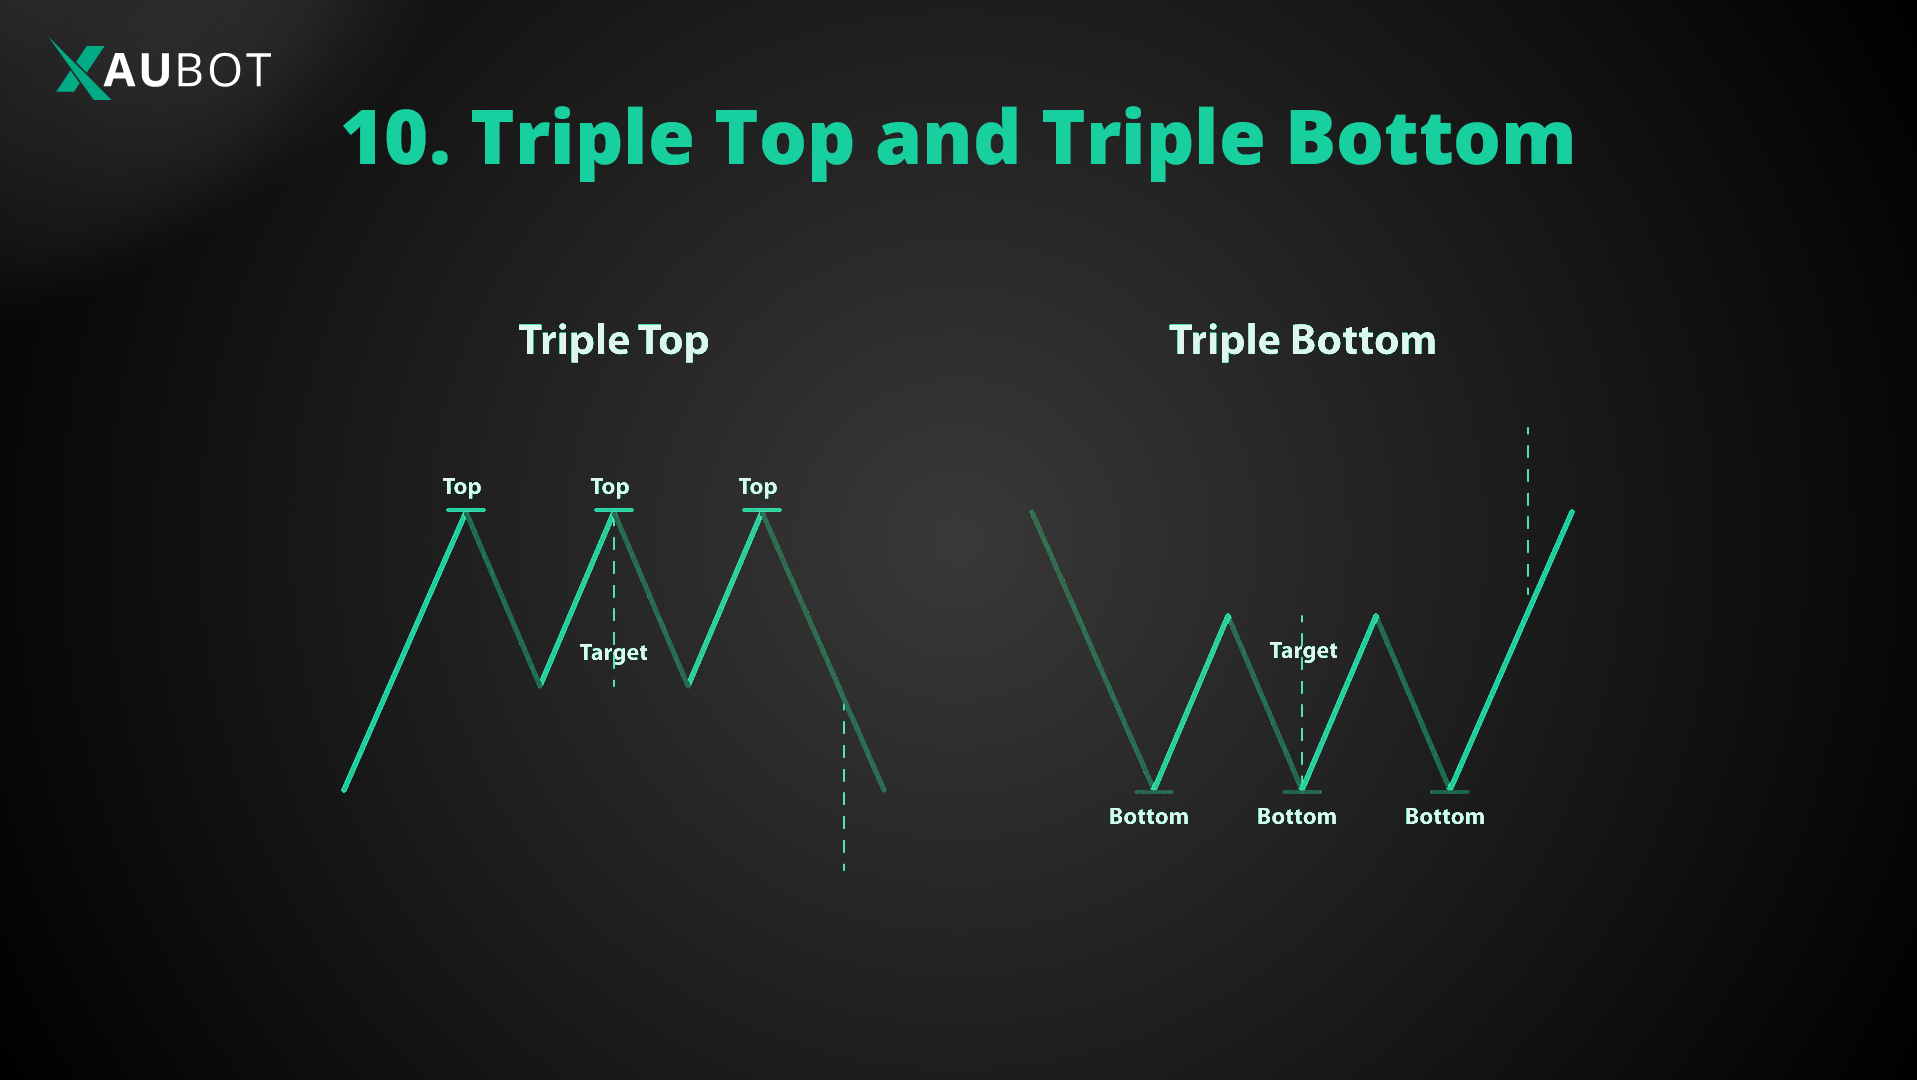
- Triple Top: as the name suggests, this pattern is made of three tops or three peaks next to each other. It kind of looks like an M shape with an extra top of course.
This is a bearish reversal pattern, which means that it signals a reversal from bullish to bearish.
The triple top is considered a strong bearish reversal because the bulls are trying to break the resistance and continue upward, but after three tops their power gives out and they fail to push upward. After the third top, prices are expected to fall down.
- Triple Bottom: of course this is the opposite of triple top. In triple bottom we have three lows or three through one after the other. So it forms a shape kind of like a W but with an extra through, because there are three lows.
Triple bottom is a bullish reversal pattern, meaning that it signals the end to the bearish trend toward bullish.
It also works in a similar way as the one above. In the triple bottom, bears are trying to push the prices down but they are running out of momentum. So, they manage to register three lows or through, but after the third one, prices are expected to bounce back up toward the bullish area.
11. Broadening Patterns (Megaphone Patterns)
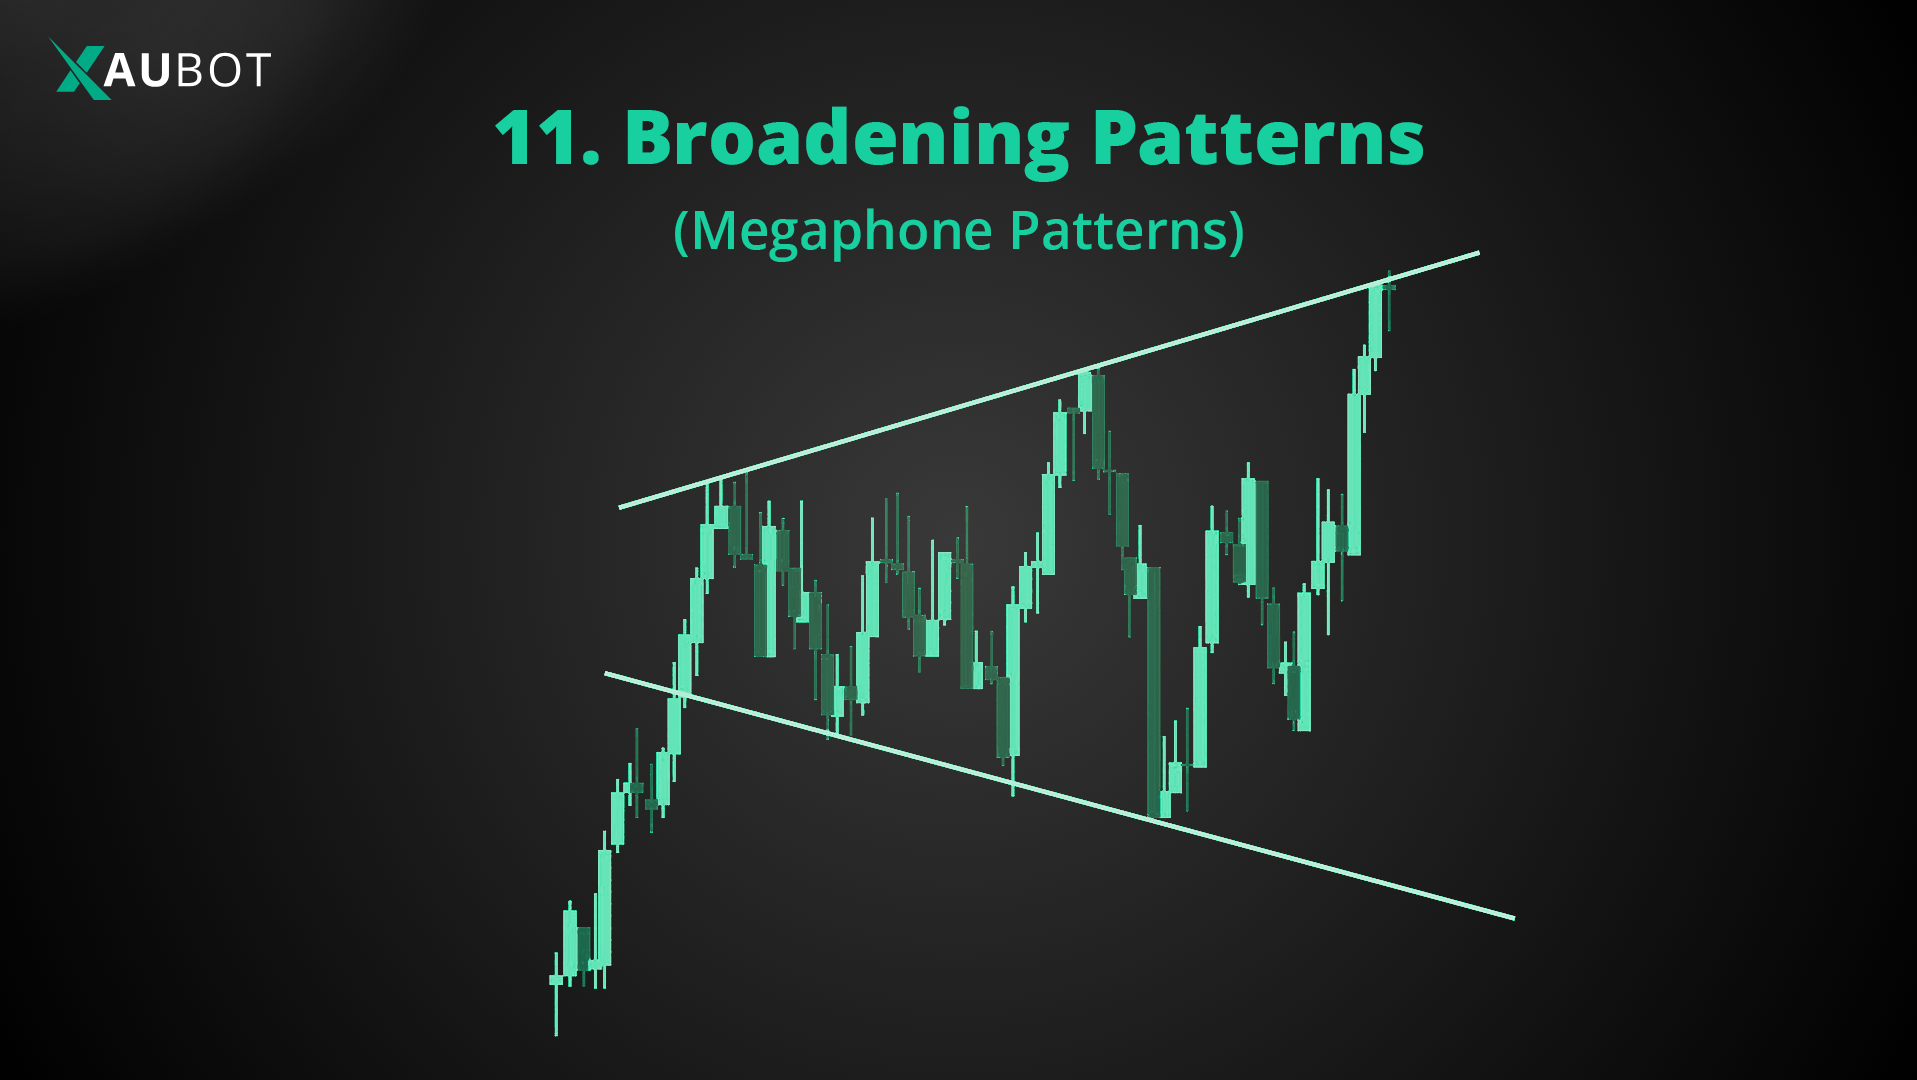
- Ascending Broadening Wedge: in this pattern we have continuous price swings that become larger and larger toward the bullish area – so it is called an ascending broadening wedge. It also looks like a megaphone held upwards.
The ascending wedge or ascending megaphone is a bearish reversal pattern. It shows that price swings upwards are getting larger and larger, pointing to the high volatility in the market.
Following the formation of the ascending megaphone, prices are expected to fall toward the bearish area.
- Descending Broadening Wedge: standing at the exact opposite we have the descending broadening wedge. In this formation we have falling price swings that get larger and larger, forming a descending broadening wedge – which also looks like a megaphone held down.
The descending megaphone is a bullish reversal pattern. This means after the formation of larger and larger falling price swings, prices are expected to reverse toward the bullish area.
12. Diamond Pattern
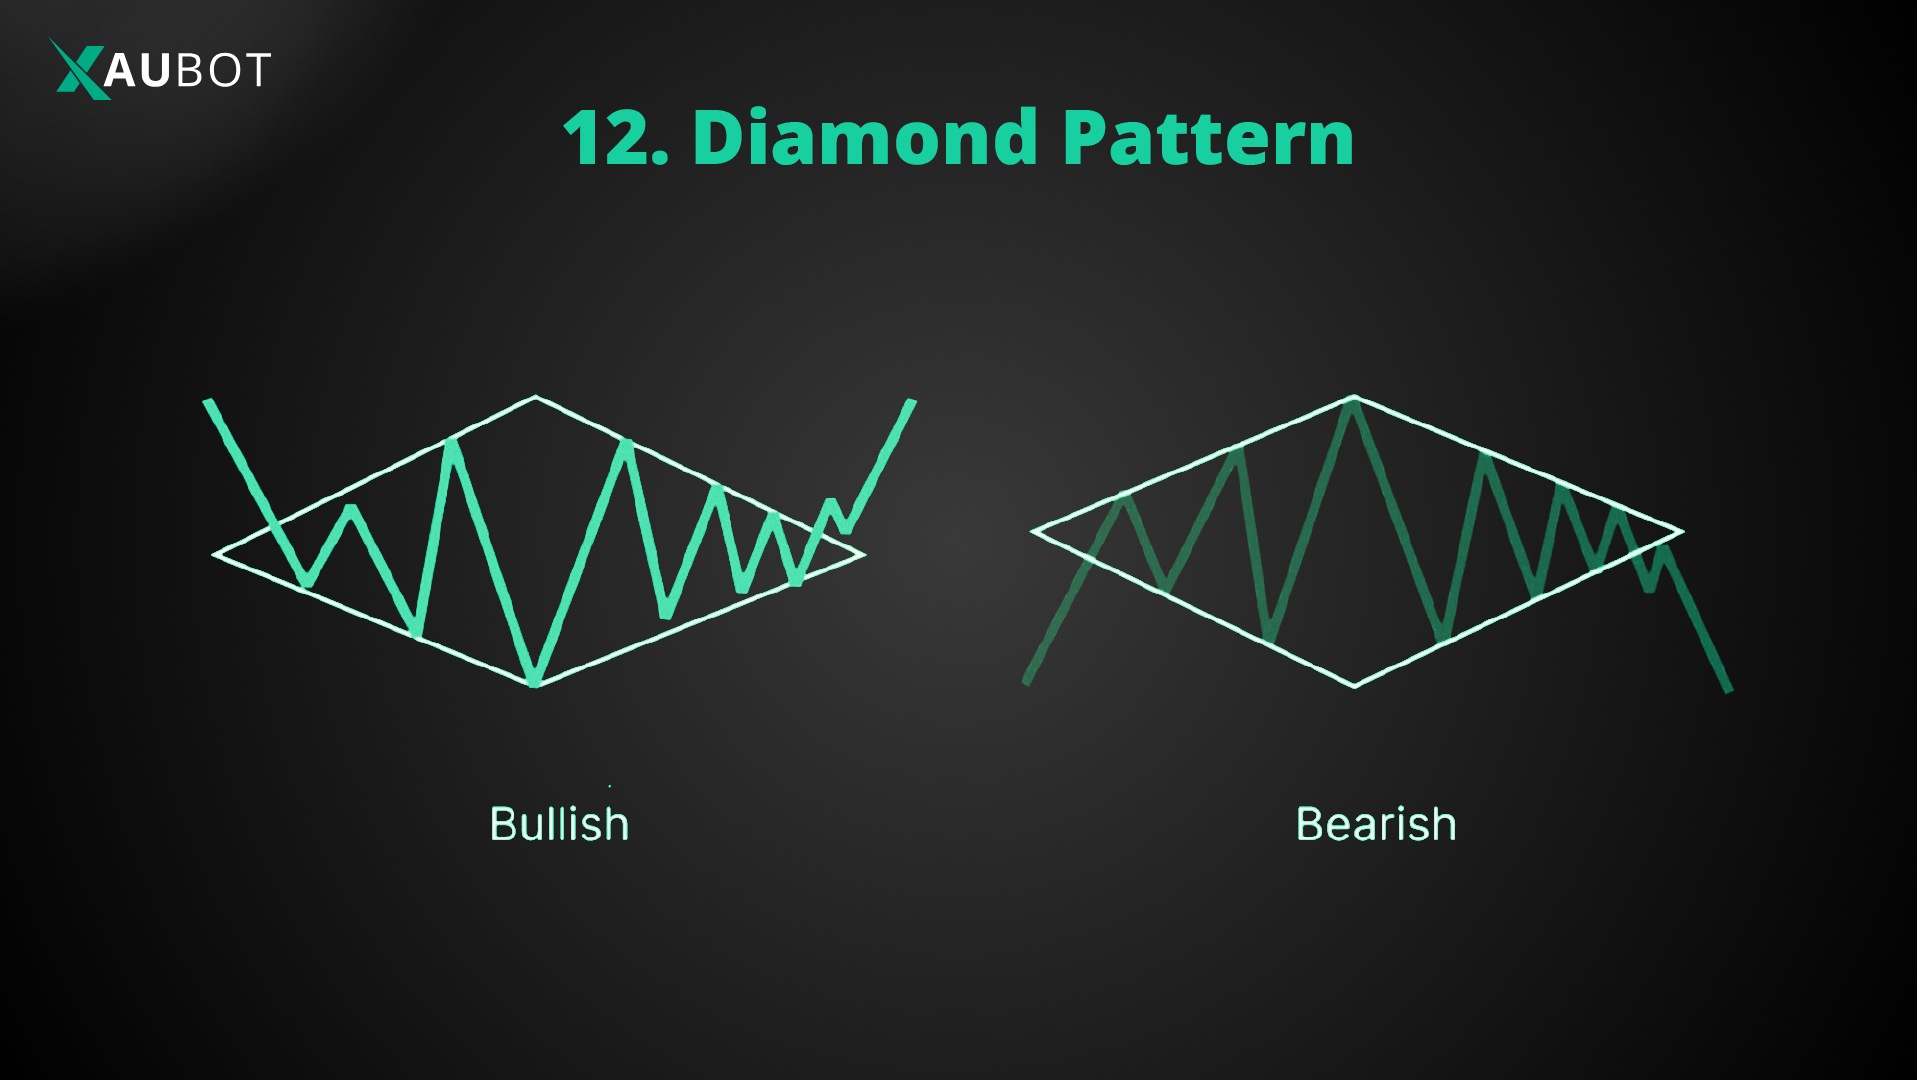
The diamond pattern is one of those truly rare patterns on the chart. The formation of this chart begins with increasingly larger price swings which is then followed by narrower and narrower price swings. As you can imagine, this forms an initial triangle followed by an opposite shaped triangle – together they form a diamond shape.
Diamond pattern is considered a powerful trend reversal pattern.
This means when this pattern forms on the chart, it is expected that the current trend will reverse. So it can be both a bullish reversal or a bearish reversal pattern, depending on the existing trend in the market.
Conclusion
So these were the top forex chart patterns for 2026. Of course there are so many different patterns in technical analysis. But these are the most useful and widely applicable chart patterns that any forex trader should know.
As you saw, each chart pattern holds valuable information about whether the forex trader should opt for the short or long position given where the prices are headed next, XAUBOT can automatically trade you without forex knowledge.

