In our series on various technical analysis patterns, it is now the turn for the famous and all powerful wedge!

Wedge is a very practical and rather easy to use technical analysis pattern that implements converging lines in order to provide information to the forex traders about upcoming trends.
Let’s take a closer look at this pattern, its characteristics, the two different types of rising and falling wedges, and how to implement them to your advantage.
The Fundamentals of the Wedge Pattern
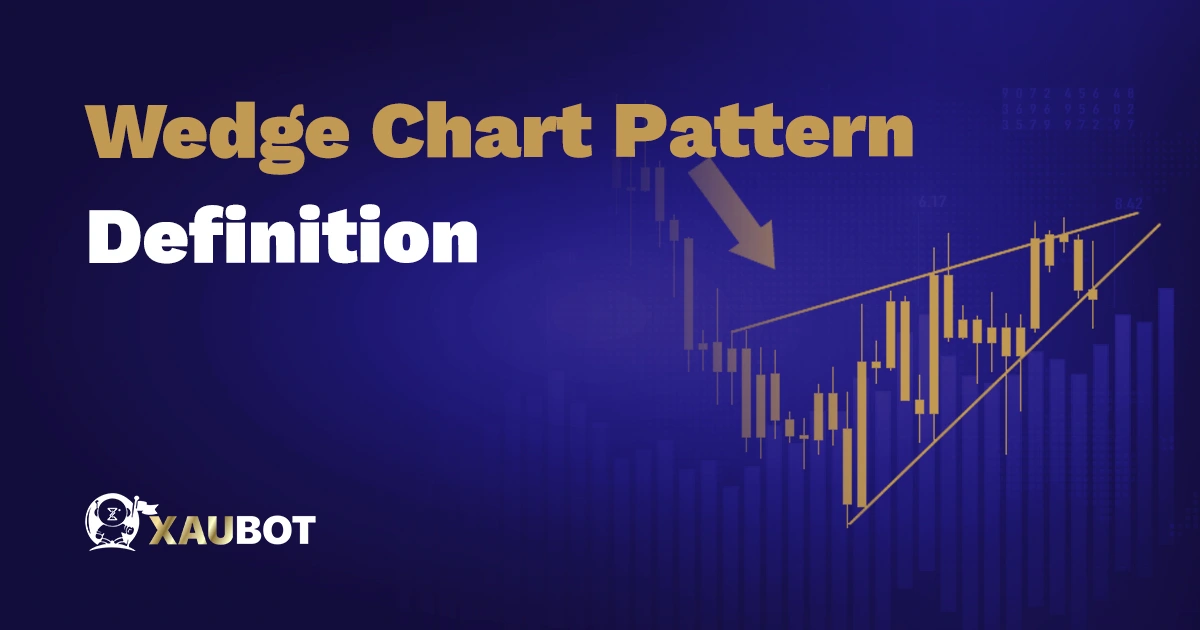
As was just mentioned, in its essence, a wedge pattern is made of two trend lines that converge on each other. These two trend lines converge or connect with each other in order to form the wedge shape.
The way these lines are formed, is that during a certain period, all the highs are connected with each other to form one line and at the same time all the lows are also connected to from the other line. When these two lines converge, the wedge can be seen.
Of course, depending on the price movements in the market during that period of time, the wedge would either be upward or a rising wedge or it would be downward, that is a falling wedge.
Wedge patterns would either indicate a reversal toward the bullish or bearish trends in the market depending on their overall shape.
In general, wedge patterns are regarded by many expert traders to be reliable patterns that predict market movements.
More Details on the Wedge Pattern

More Details on the Wedge Pattern
Of course, we have two different patterns of wedge – one that is rising and another that is falling. So, depending on the rise or fall of the shape, a wedge pattern could be indicative of a bullish or bearish reversal.
No matter which shape you find in the chart at any given period, a wedge pattern must contain features that are threefold.
First and foremost, it needs to have two converging trend lines. This is kind of an obvious feature, since without two converging lines, we wouldn’t even have a wedge pattern.
Next, the second feature of any wedge pattern is that the trade volume in the market or for a specific forex trading pair must be dropping throughout the formation of the wedge shape.
The last and third feature is the eventual price break out that is expected of any wedge pattern.
We will see more in detail, but for a falling wedge the price breakout will signal a bullish market and for a rising wedge the price breakout will indicate a bearish market on its way.
One last point about the wedge pattern in general, the wedge pattern is by and large regarded to be a reversal pattern – though there have been those rare exceptions where we have observed a continuation with the wedge pattern.
Now let’s take a better look at the two types of wedge patterns: rising and falling.
Rising Wedge Pattern
Contrary to what the name might give out, a rising wedge pattern is a reversal pattern that indicates an upcoming bearish trend. For the wedge shape to be rising, it would naturally begin from a lower point, and then move higher and higher until the two trend lines fully converge with each other.
So, two essential features of a rising wedge pattern are that the two trend lines converge with each other as they rise higher, and that the price break out will surely be toward the bearish area.
Of course the rising wedge is a bearish reversal. And for the reversal to take place, we need an already existing trend in the market. Over a certain period of time, it is observed in the market that the prices are rising, of course they are at a rising slope.
Two other features of the rising wedge are that first the resistance line should be formed with two to three high hits and, second, the support line ought to be formed by two to three low hits, at the very least.
This is when all would come to fruition. The two rising slopes would get closer and closer to each other until such a moment that they fully converge. Of course this is not the end. The most important moment is when we see a significant break through the support line. Now keep in mind that this break should be significant enough to provide assurance that the support has been well broken through. This is when the result of a rising wedge can be seen.
But keep in mind after the support line is broken, prices might rally a little bit just to test the new resistance line. But the bearish trend has already begun.
Falling Wedge Pattern
Falling Wedge Pattern
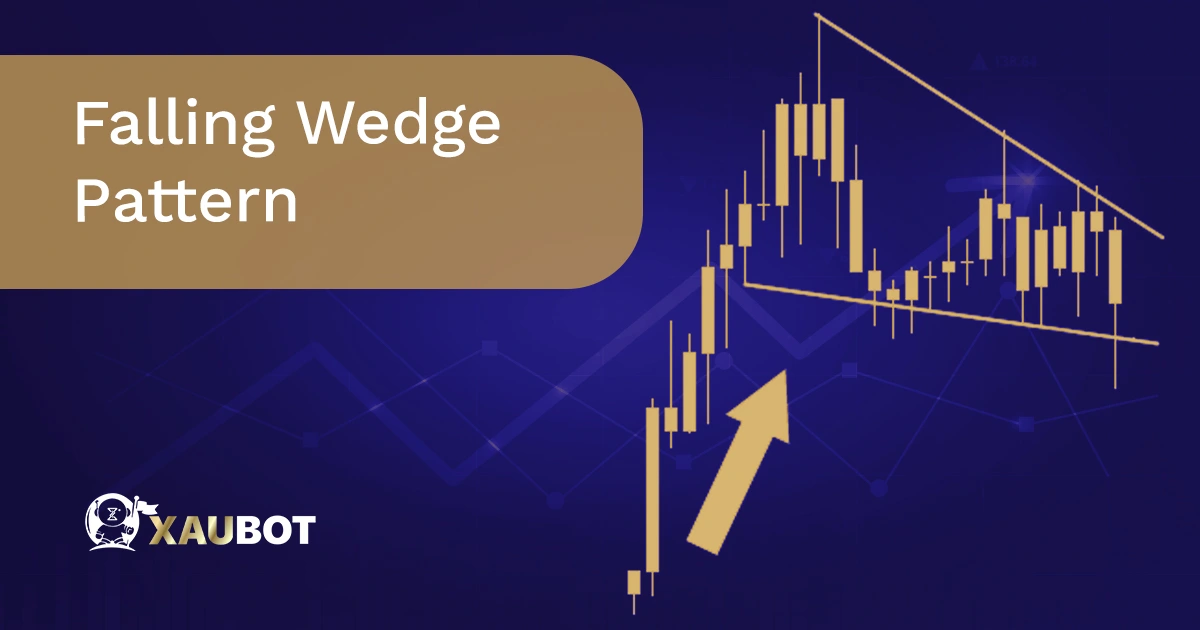
On the other hand, we have the falling wedge pattern, which is of course a bullish trend reversal. Contrary to the rising wedge, the falling wedge has higher beginnings. It begins from higher up and then moves downwards until such time that its trend lines converge with each other.
Much like the rising wedge, for the falling wedge a number of falling highs form the new resistance line and a number of lower lows will form the support line. As these two lines fall, they converge and the most important part of the falling wedge is when the resistance line is broken.
You see, when the resistance line is broken and the breakout is quite significant that is when we can say the bullish reversal has taken place. Similarly, after the resistance level is broken toward bullish territory, prices might bounce up and down a little bit to find the new support line, but the overall trend will surely remain a bullish one.
Conclusion
The wedge pattern is one of the most reliable chart patterns in the forex market that can help any trader recognize a price and trend reversal. There are two major types of wedge patterns, one that is falling and the other that is rising.
The falling pattern is indicative of a bullish trend. Because the falling resistance and support lines are made of smaller and smaller highs and lows, it indicates that the downward momentum of the market is about to run out of energy and that we can expect a reversal in trend.
On the other hand, a rising wedge pattern indicates a bearish trend. And for similar reasons – i.e. as the rising resistance and support lines are made of smaller and smaller highs and lows, it is a signal that the upward momentum is getting weaker, heading toward an eventual breakout in the opposite direction.

