Hindsight is 20/20 as they say. But unfortunately a hindsight that doesn’t help with the foresight is merely remembering the past.

In the matter of trading, especially forex trading, there are various tools and techniques that can provide this hindsight for traders, which can then be used to gain foresight with regard to the market and price movements.
This so-called window to the past is the symbolic and iconic trading chart. Seemingly a mere depiction of data at first, forex trading charts have many secrets to unveil. But in order to do so, traders need to know the magical incantations otherwise known as technical indicators.
In this article we want to familiarize you first with the fundamental notion of a trading chart, and then its different types, especially the ones that are most widely used in the forex market.
Forex Chart: Window the Past, and Future!
In essence, a forex chart is the pictorial representation of the past price movements and performance of a given trading pair in the forex market.
The comprehensiveness and breadth of this chart will ultimately depend upon the time frame applied to it. The bigger the time frame the wider the chart.
The real function of forex charts does not merely have to do with the information it provides about the past. However, the vitality lies within the patterns that can be detected in the past price movements.
Also Read: Top Chart Patterns in Forex in 2023
This is how professional traders and market analysts can provide a pretty precise prediction of the future price movements depending on the past patterns available to them with the help of a chart.
Therefore, forex charts are absolutely essential for any trader who wants to obtain a dependable forecast of the upcoming changes in the price of a trading pair so that they can make sound decisions in the market.
What Are Different Forex Charts?
In the field of finances and economy, there are many different types of price charts that are used in various financial markets. As a forex trader it is essential for you to be familiar with all of these different price charts, which we’ll discuss momentarily.
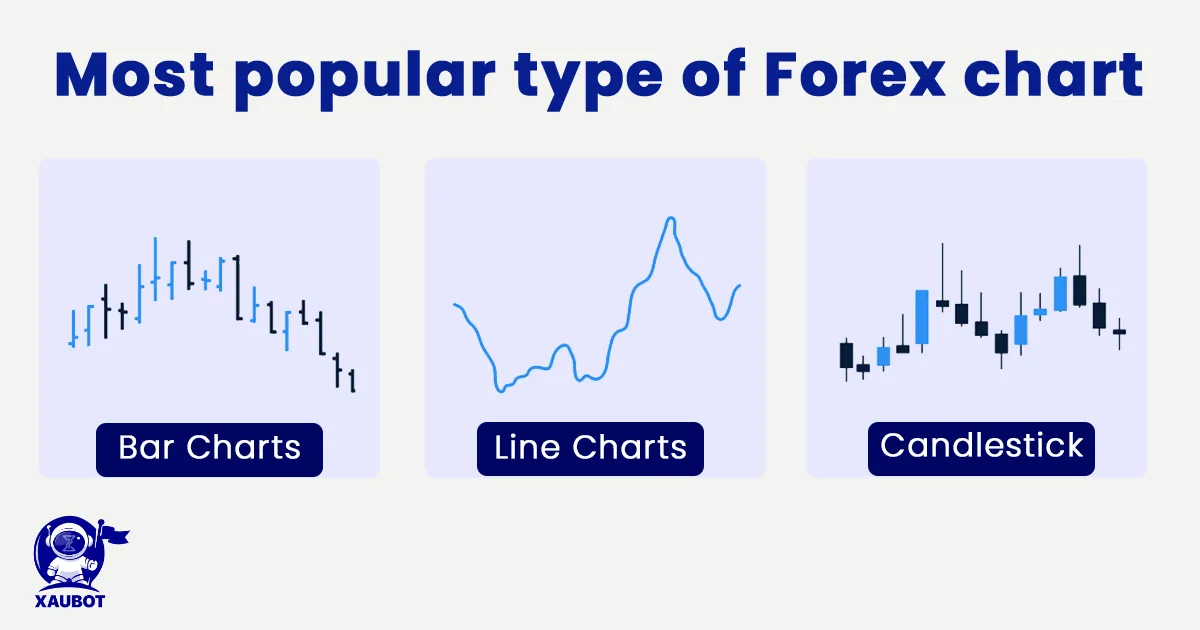
But before delving into them, it is also noteworthy to mention that among all these price charts, some of them are much more widely used in the forex market than others, namely bar charts, line charts, and candlestick charts.
Of course as mentioned above, we shall now discuss all price charts that could be relevant to the forex market.
Bar Charts
bar charts forex
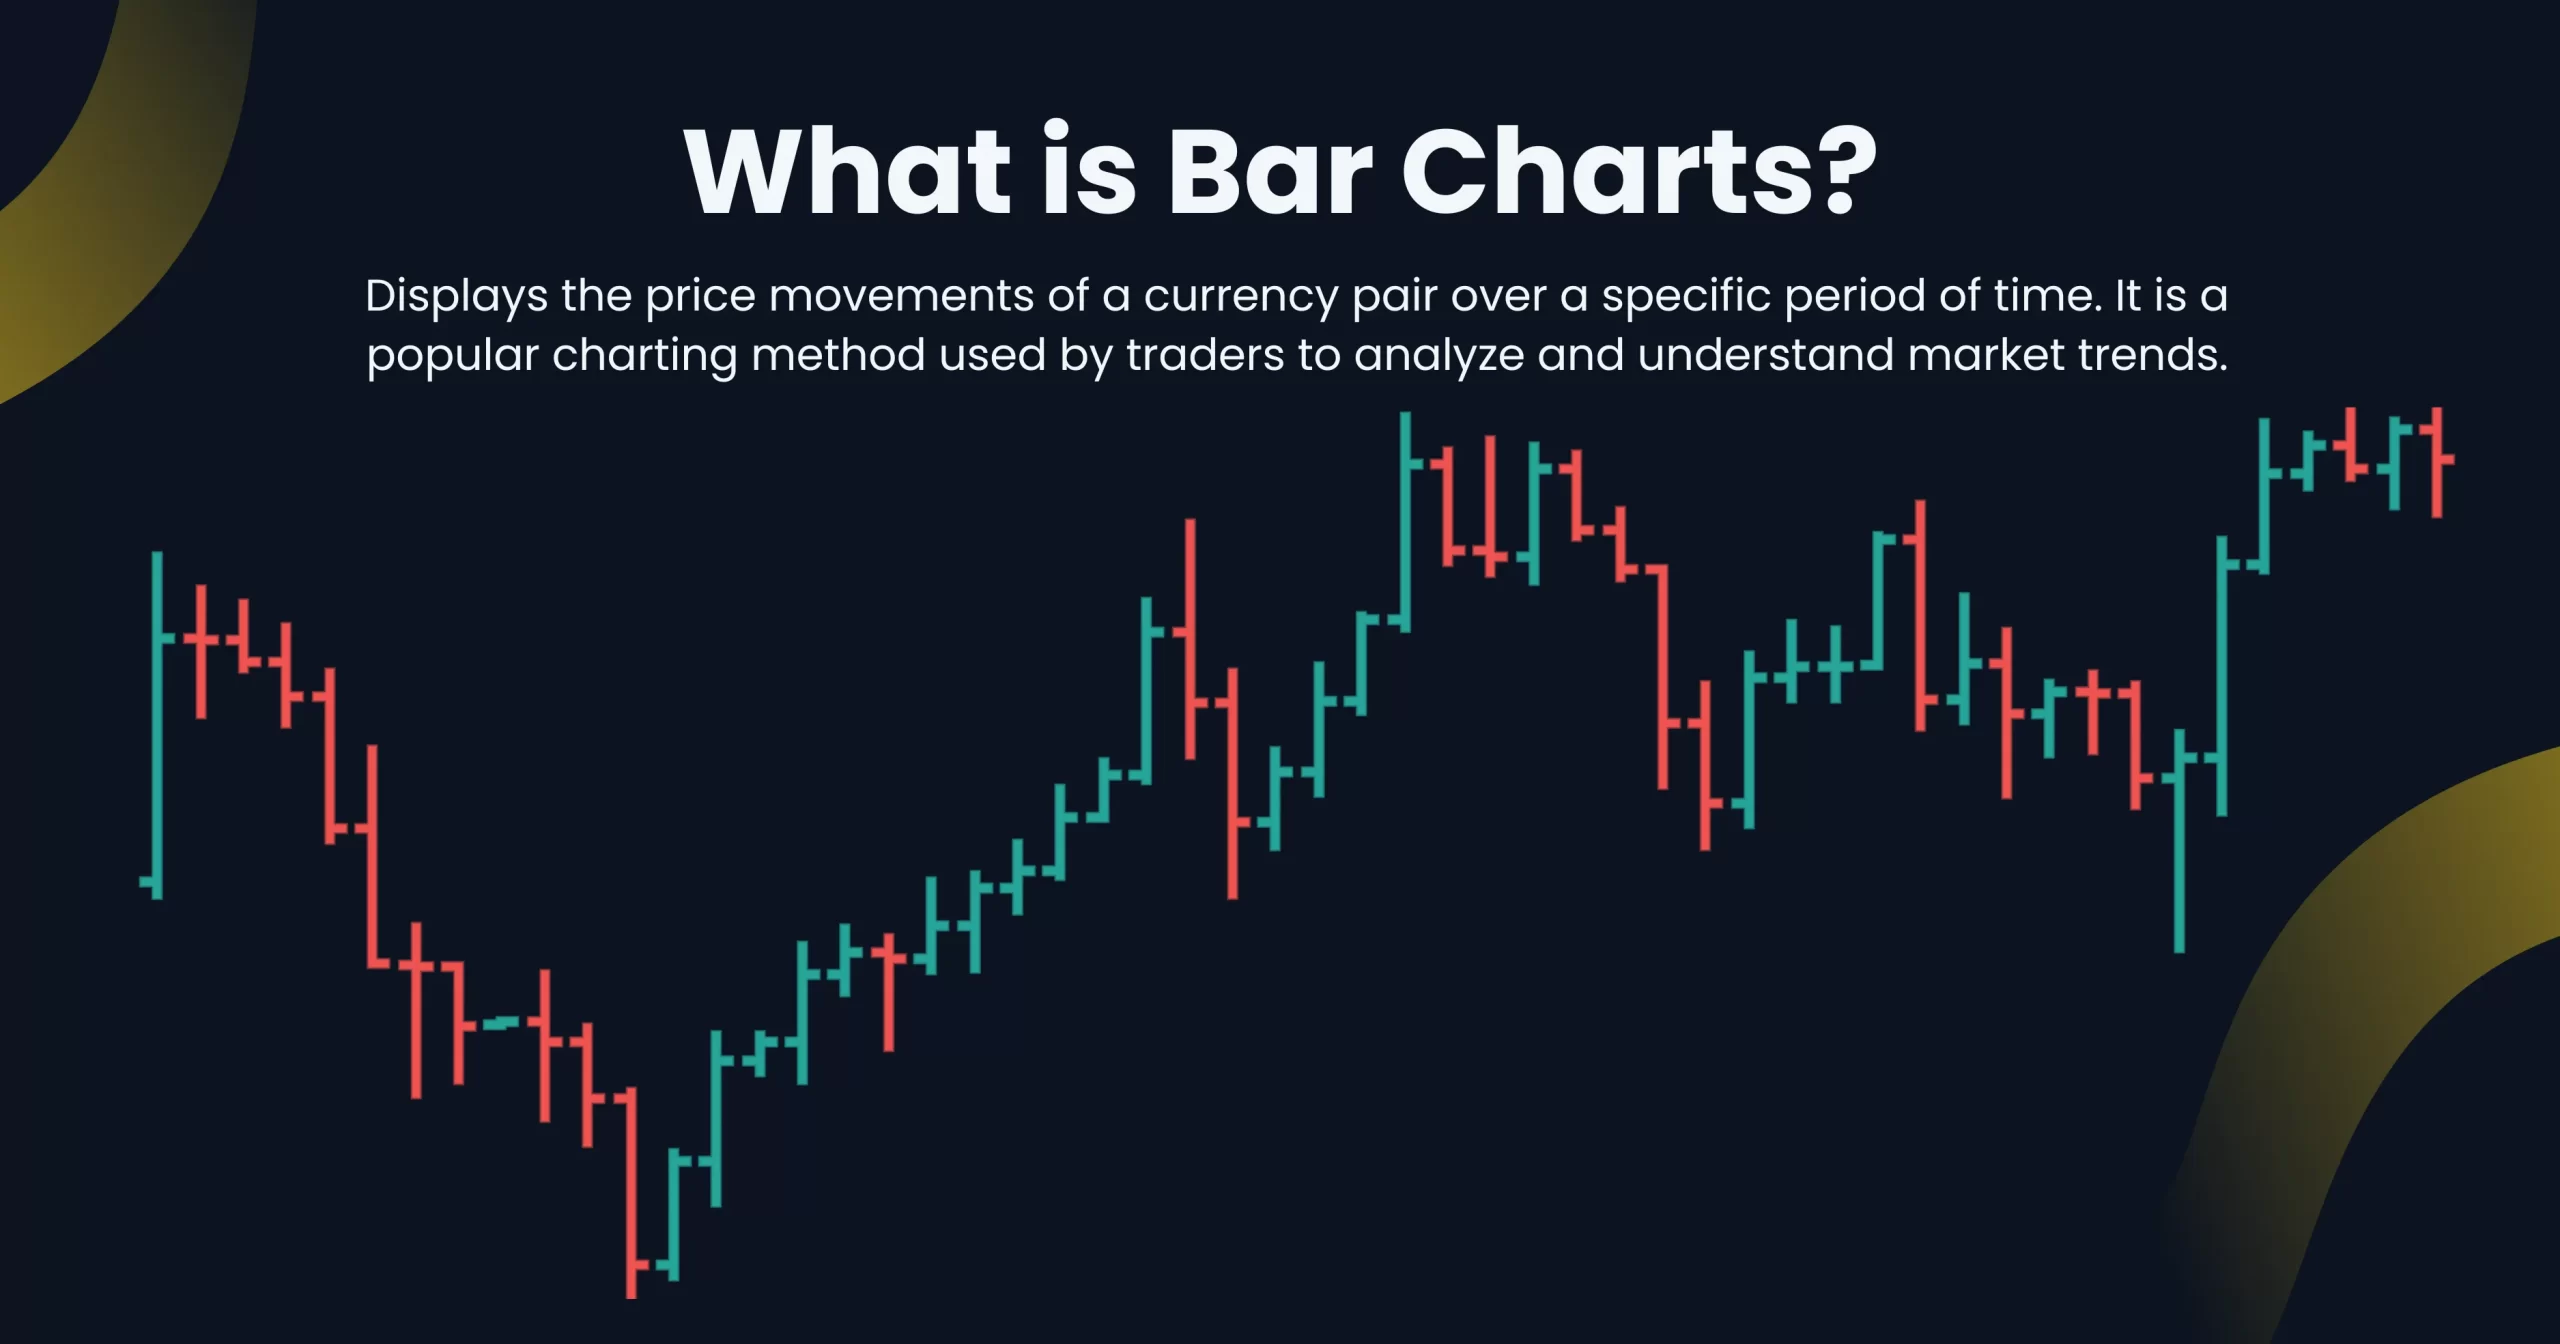
Bar charts can be regarded as the most well-known price charts in financial markets and the trading world in general. As the name suggests, bar charts are made up of bars showing the price action in the chosen time period.
Of course such charts are only made up of vertical lines, or the so-called bars. As such the main part or each bar is of course representative of the price. Each vertical line has a point to its left and another point to its right. The left-hand point indicates the opening price and the right-hand point indicates the closing price.
Clearly each new bar wouldn’t be the start of the price all over again. In fact, each new bar will merely continue from where the previous bar had left off. The rest depends on the price movements, whether descending or ascending. And this is how taller and shorter bars are created on the chart.
As was mentioned above, bar charts are extremely popular especially due to the fact that they are most widely used with technical analysis tools.
Line Charts
line charts forex
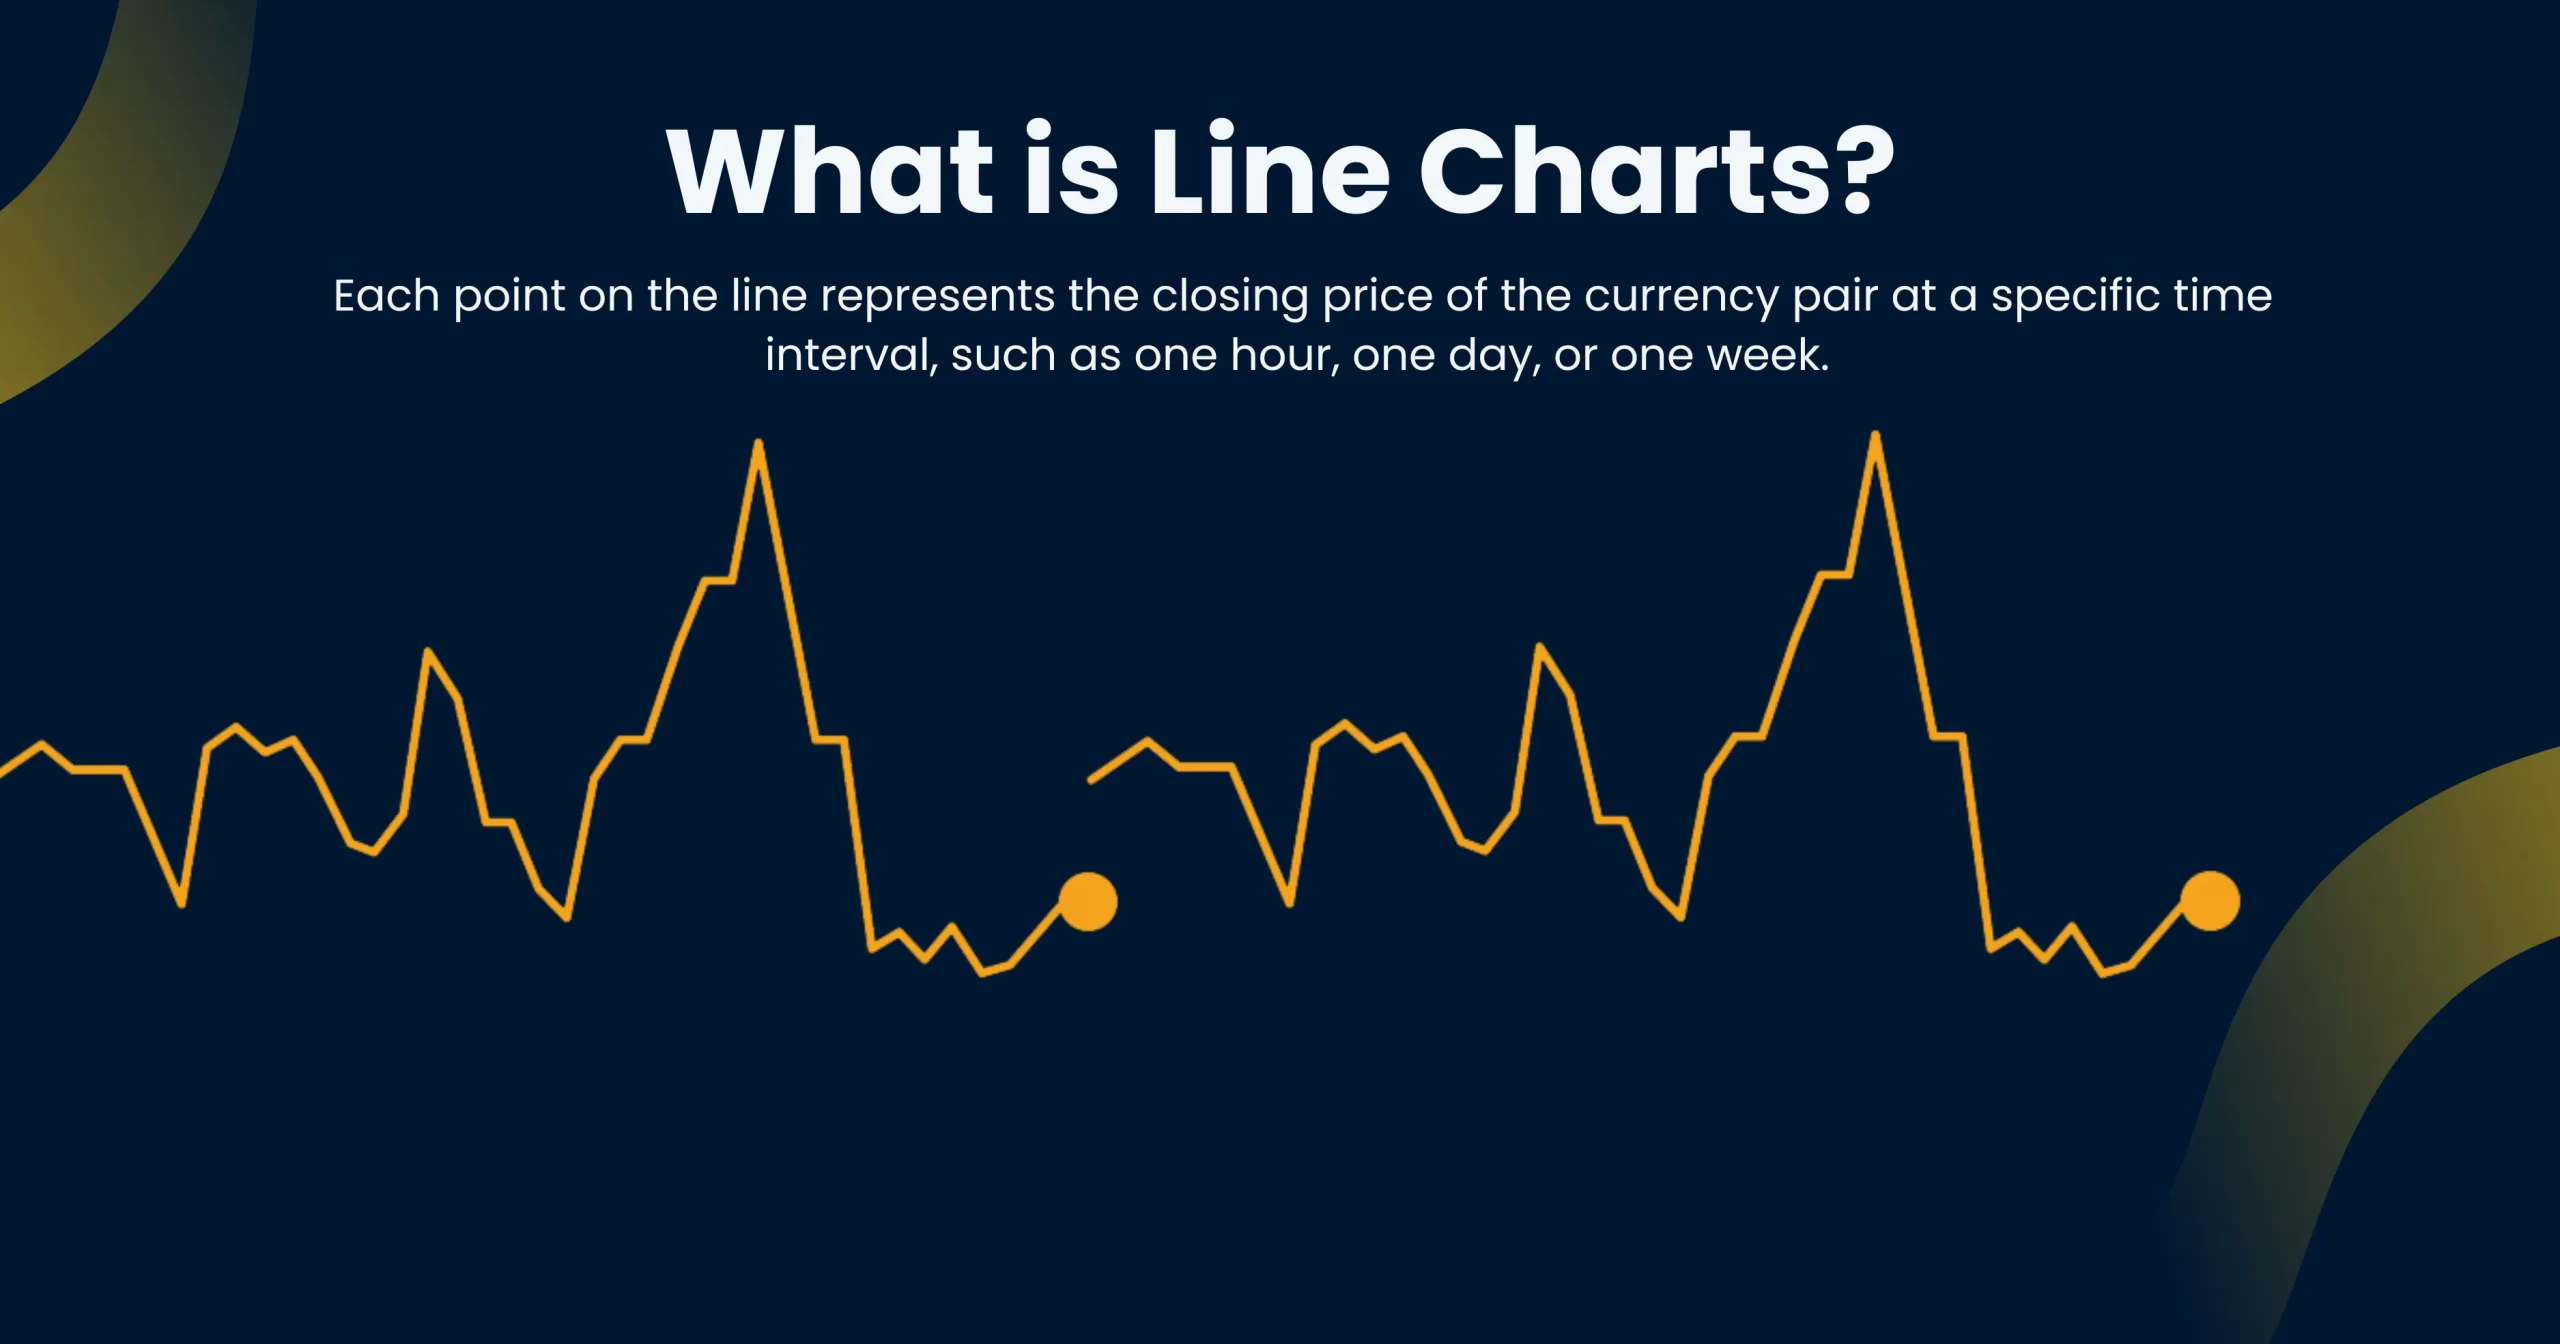
Each price chart will ultimately have its own advantages for traders. The advantage of the line chart is its extreme simplicity. It is very straightforward to look at and understand. A line chart is a simple line that depicts the price at any given time point on the horizontal axis – which can vary depending on the chosen time period.
Given the fact that line charts are simple in their representation of data and price actions, it is also much easier to apply technical analysis tools and obtain general patterns. Although, precisely because they are too simple, perhaps they are not the go-to choice for professional traders as their main price chart.
Candlestick Charts
candlestick chart forex
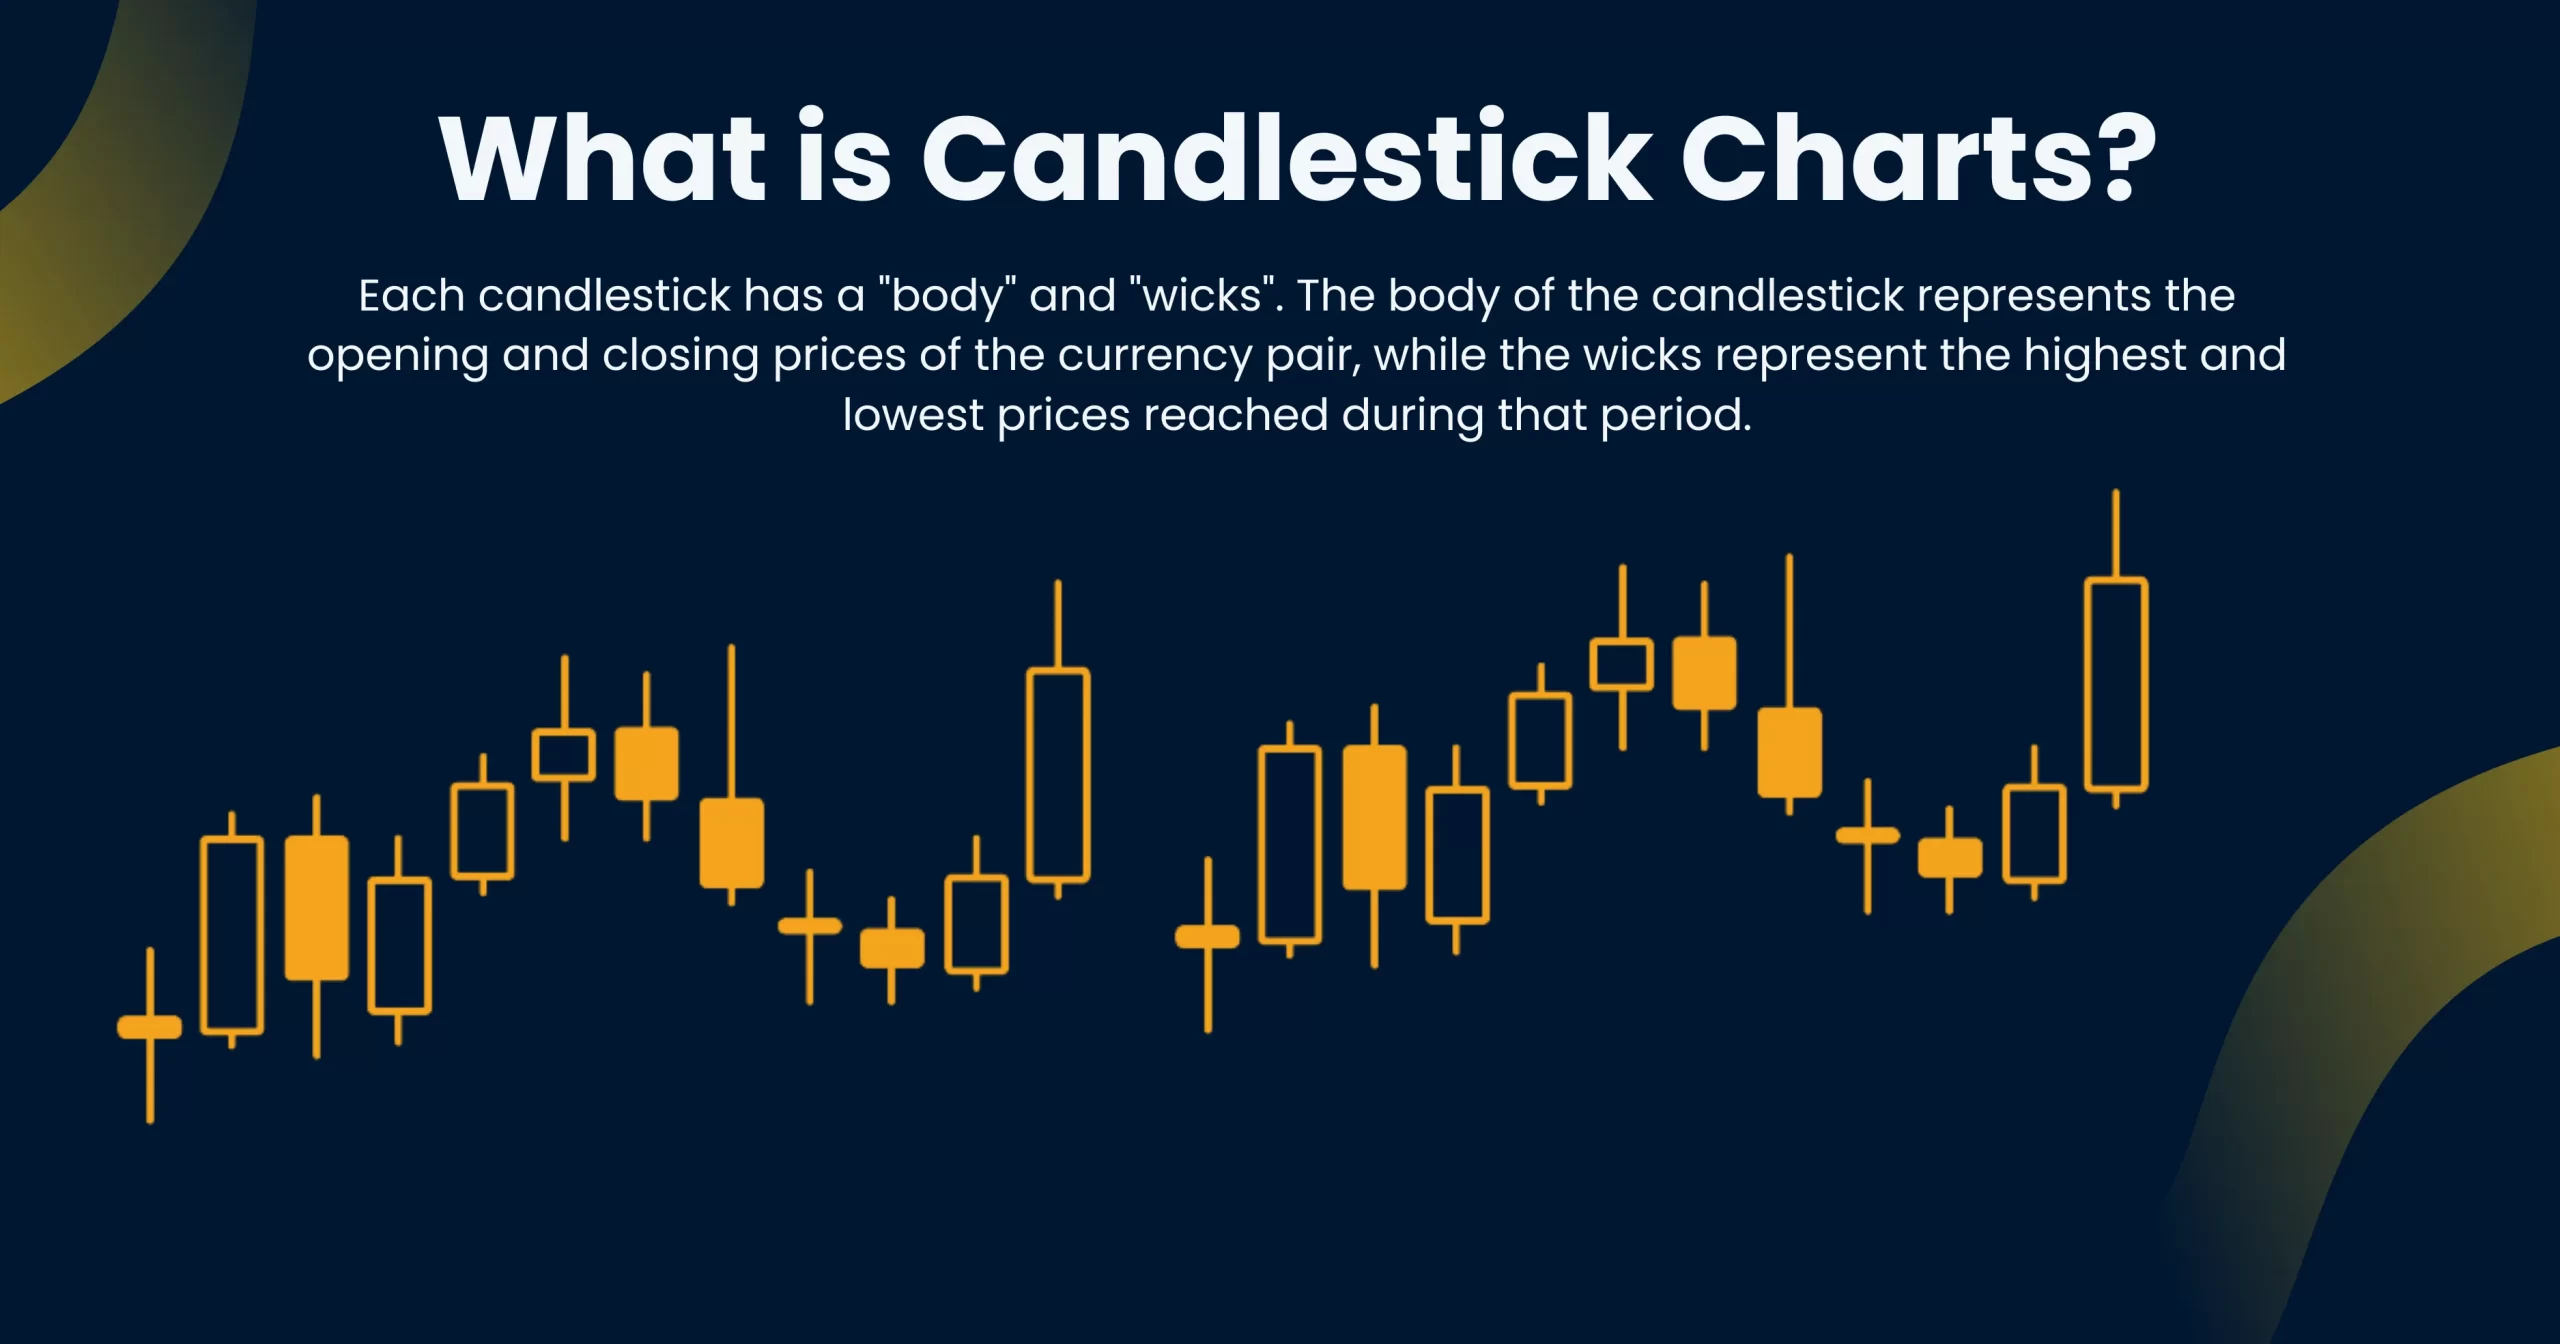
Another widely implemented price chart in forex markets is known as the candlestick chart. Naturally, such charts are made up of candles. On the face of them, candlestick charts are very similar to bar charts, except that other than the main part of the body, candlesticks also have a shadow, which we’ll discuss shortly.
Another similarity between candlestick and bar charts is that they both represent the opening and closing prices, in addition to the highest and lowest price at any given time point in the overall time period.
So what are the bodies and shadows of candlesticks? The body of a candlestick is the price action that occurs from the open to the close. Depending on the movement having been negative or positive the color of the body might be red or green respectively.
The shadows of candlesticks are also related to the price action. They basically indicate the highest and lowest points with regard to price in that given body. As such a body can have a candlestick above it, below it, or both. Therefore, shadows can also be regarded as indications as to where the price might be headed next.
Tick Charts
Taking a turn to a different type of chart, we now get to tick charts. Unlike what we discussed so far, tick charts do not represent price action and are not based on time intervals either.
Tick charts represent a new bar consisting of data pertaining to the volume or number of transactions after a certain interval of data has been surpassed. So the presentation of data is not temporal or chronological, but based on hitting a certain threshold.
Tick charts can provide traders with extremely valuable data related to the actions and trades performed in the market.
Heiken-Ashi & Renko Charts
Last items on our lists are both Japanese renditions of the more well-known price charts such as candlestick or bar charts.
Heiken-Ashi charts are very similar to candlestick charts. In fact, many regard them as the Japanese version of candlestick. But with the difference that Heiken-Ashi charts can provide a much more straightforward chart compared to ordinary candlestick charts. This is because Heiken-Ashi records price movements in range rather than recording all of them. Therefore the final data is much more smooth.
Along the same lines, Renko charts are also very similar to candlestick charts. But with the difference that instead of candlesticks, they use Renko which is Japanese for brick. These bricks will ultimately provide a denser price chart, which some market analysts believe Renko charts provide better data with regard to support and resistance levels.
Conclusion
There are many different types of forex charts. Each type has its own peculiarities and thus advantages. Although some charts are more widely known within the forex and trading communities, as a forex trader you need to be familiar with almost all of them. This is because certain charts have gained their popularity due to their simplicity.
And of course, the best way is not always the simple one. Sometimes you need to opt for a different type of chart for a better understanding of market patterns. Of course, there are numerous charts used in financial markets, but here we discussed six charts that are more widely used in the forex market.
FAQ:
Q: What are forex charts and why are they important for forex traders?
A: Forex charts are graphical representations of currency price movements over time. They display price data for a currency pair, such as the exchange rate between the US dollar and the euro, and can show this data over different time periods, such as minutes, hours, days, weeks, or months. Forex charts are an essential tool for forex traders because they provide valuable information about market trends, price movements, and potential trading opportunities. By analyzing forex charts, traders can make informed decisions about when to enter or exit trades, and can develop trading strategies based on historical price patterns and technical indicators.
Q: What types of forex charts are available and which one should I use?
A: There are several types of forex charts available, including line charts, bar charts, and candlestick charts. Line charts show the closing price for each period, and can be useful for identifying overall trends. Bar charts show the high, low, and closing price for each period, and can provide more detailed information about price movements. Candlestick charts are similar to bar charts, but use colored bars to show whether the closing price was higher or lower than the opening price. They can be helpful for identifying support and resistance levels, as well as patterns such as hammers, doji, and engulfing patterns. The type of chart you use depends on your trading style and personal preferences. Some traders prefer simple line charts, while others prefer more detailed candlestick charts. It’s a good idea to experiment with different chart types to see which one works best for you.

