

Anyone can post a screenshot of a green balance and call it proof. Myfxbook exists because screenshots can be cropped, edited, or taken from a demo account with no real money behind them. If you are trying to decide whether a trading bot’s results are real, Myfxbook is usually the first place to check, and knowing how to actually read it is what separates an informed decision from a hopeful one.

This guide walks through Myfxbook from the ground up: what it is, how the verification actually works, and how to interpret every number on a results page. We will use XAUBOT’s own live Myfxbook account as the working example throughout, so you can follow along with real, current numbers instead of a hypothetical.
What Myfxbook Actually Is
Myfxbook is an independent, third party platform that connects directly to a trading account (MetaTrader 4, MetaTrader 5, or cTrader) and pulls the account’s real trading history automatically. Nobody manually types in results. The platform reads the account’s actual trade log, balance history, and open positions, then displays them publicly.
That distinction matters. A bot developer cannot simply write “80% win rate” on their own website and expect anyone to take it seriously. Myfxbook removes the developer from the reporting process entirely. Once an account is connected, the numbers update on their own, trade by trade.

How Verification Actually Works
This is the part most traders skip past, and it is the part that actually matters.
When someone connects an account to Myfxbook, they do it using what is called an investor password, not the main trading password. An investor password is a read only credential that most trading platforms generate separately from the full login. It lets Myfxbook see every trade, deposit, and withdrawal on the account, but it cannot place a single trade or move a single dollar.
Once the investor password is entered, Myfxbook checks it against the broker’s own servers in the background. If the credentials are valid and continue to match the live account, the system marks the track record as verified, shown with a small badge on the results page. If someone tries to fake this by uploading trade data manually instead of linking a real account, there is no verified badge, and that absence is itself useful information.
So the first thing worth checking on any Myfxbook page, before looking at a single number, is whether the account shows as verified. On XAUBOT’s live account, this connection has been active continuously since the account was opened, which is what allows every number below to be checked against the live trading history rather than taken on faith.
Reading the Summary Panel
At the top of every Myfxbook results page sits a summary panel. Here is how to read each line, using XAUBOT’s own account as the live example (please do keep in mind that he default strategy is High Risk).
Gain and Absolute Gain. These are the two most misread numbers on the entire platform, and they are rarely the same figure. Gain is calculated using a time weighted return, meaning it measures the account’s growth in percentage trade by trade, adjusted for exactly when money was deposited or withdrawn. Absolute Gain is simpler: it is total profit divided by total net deposits, with no adjustment for timing.
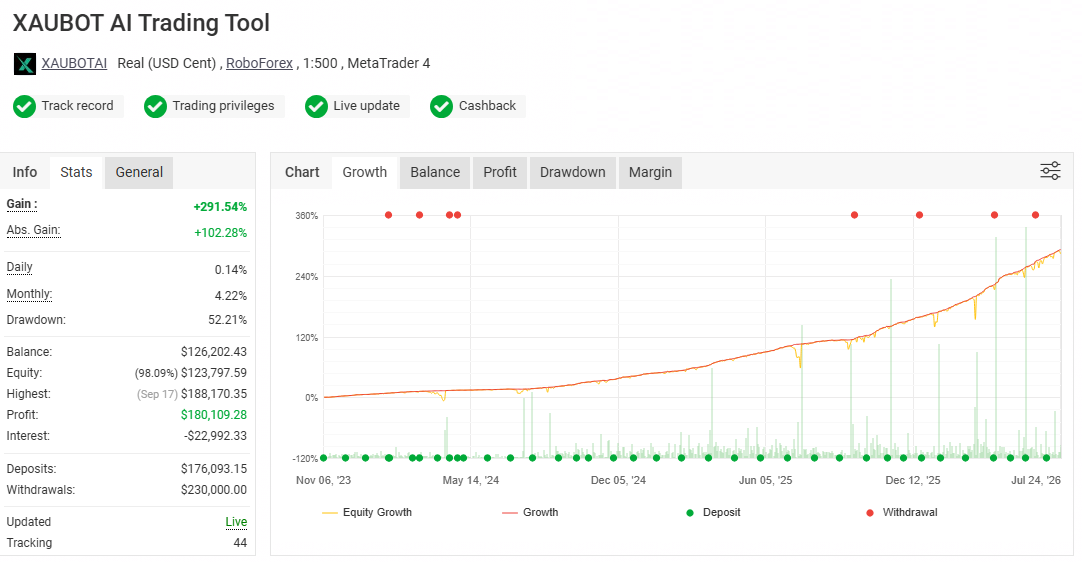
On XAUBOT’s account, Gain currently sits at +291.54% while Absolute Gain sits at +102.28%. That gap is not a red flag by itself. It is a direct result of the deposit and withdrawal history: this account shows $176,093.15 in total deposits against $230,000.00 in withdrawals over its life. Every time funds are pulled out mid cycle, the time weighted Gain figure and the simpler Absolute Gain figure will separate further. The lesson here applies to any account you are evaluating: if Gain and Absolute Gain are close together, the account has seen little deposit or withdrawal activity. If they are far apart, check the deposit and withdrawal history before assuming one number tells the whole story.
Drawdown. This is the largest peak to trough decline the account has experienced, expressed as a percentage. It is arguably the single most important number for anyone trying to match a bot to their own risk tolerance, because it answers a very specific question: how much of your account could you have watched disappear before it recovered? On XAUBOT’s account, drawdown currently reads 52.21%. That is a meaningful number and worth being direct about: an account with drawdown in this range demands a trader who can tolerate significant equity swings without panic closing positions, which is exactly why matching a bot’s historical drawdown against your own comfort level matters more than chasing the highest headline gain.
Withdrawals. This is another important indicator to keep in mind when assessing a strategy on this platform. Looking at the withdrawals that have been made and their consistency. For XAUBOT, it has had a consistent record of withdrawals for more than 4 years. This is highly indicative of the performance of the strategy.
Balance, Equity, and Profit. Balance is the account value after all closed trades. Equity is Balance adjusted for any trades still open at that moment, so it moves in real time. Profit is the total dollar gain since the account began. On this account: Balance sits at $126,202.43, Equity at $123,797.59 (98.09% of balance, meaning open trades are currently sitting at a small floating loss), and total Profit stands at $180,109.28 since inception.
The Advanced Statistics Tab
Past the summary panel, Myfxbook offers a deeper statistics tab that most casual visitors never open, which is exactly why it is worth learning.
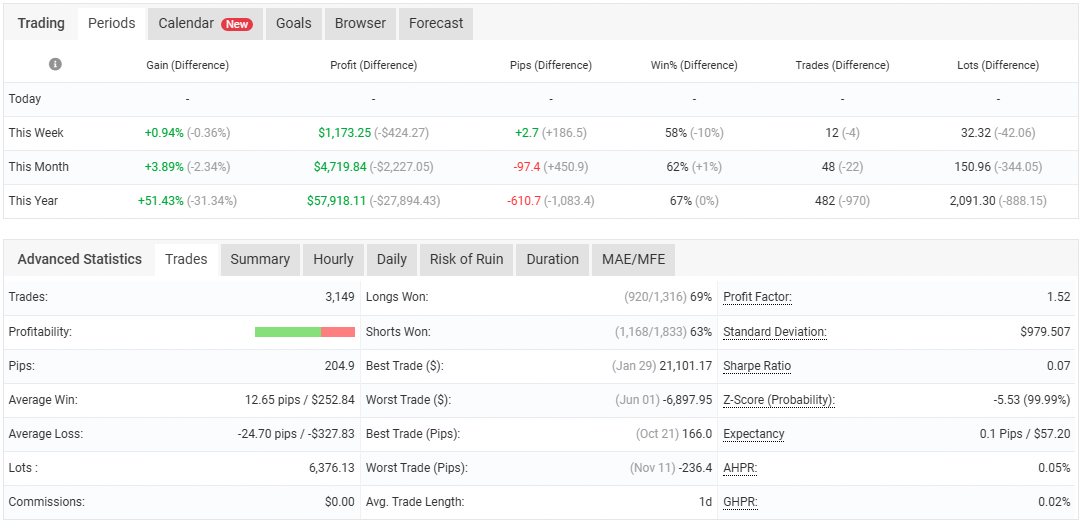
Profit Factor. This is gross profit divided by gross loss. A Profit Factor above 1 means the account has made more than it has lost overall; below 1 means the opposite. XAUBOT’s account currently shows a Profit Factor of 1.52, meaning for every dollar lost, roughly a dollar fifty has been made.
Win rate by direction. Myfxbook separates long and short trades, which is a detail worth checking rather than skipping. On this account, long trades have won 69% of the time (920 out of 1,316), and short trades have won 63% of the time (1,168 out of 1,833). A large gap between these two numbers can reveal whether a strategy is genuinely balanced or quietly leaning on one market direction.
Average Win versus Average Loss. A high win rate on its own can be misleading if the losses, when they happen, are large. On this account, the average winning trade is 12.65 pips or $252.84, while the average losing trade is -24.70 pips or -$327.83. This is a case worth sitting with for a moment: losses are, on average, larger than wins here. The strategy remains profitable because of the win rate and Profit Factor together, not because each individual loss is small. This is precisely the kind of nuance a single headline gain figure will never show you, and precisely why reading past the summary panel matters.
Expectancy. This figures out the average result you can expect per trade, combining win rate and average win and loss size into one number. Here it reads 0.1 pips, or $57.20 per trade, across 3,149 total trades.
Putting It Together: Matching a Track Record to Your Own Trading Style
None of these numbers exist in a vacuum, and this is where a verified Myfxbook page becomes genuinely useful rather than just informative. A trader with a small account and low risk tolerance is looking for something entirely different from a trader running a large account who can sit through a 50% drawdown without flinching. The same track record can be exactly right for one person and completely wrong for another.
This is the actual reason platforms like XAUBOT start by helping a trader work out their own trading style before pointing them toward a bot at all. A verified Myfxbook page tells you what a strategy has actually done. It does not tell you whether that strategy fits your account size, your patience, or your risk appetite. Those are separate questions, and they matter just as much as the numbers on the page.
A few practical habits worth building when reading any Myfxbook page, not just this one:
- Check the verified badge before reading anything else
- Compare Gain against Absolute Gain, and check deposit and withdrawal history if they differ significantly
- Treat Drawdown as the number that tells you whether you personally could have stayed invested through the worst period on the chart
- Look at Profit Factor and win rate together rather than either alone
- Open the advanced statistics tab instead of stopping at the summary panel
A Final Word on Reading Any Track Record
Past performance, verified or not, is still past performance. A verified Myfxbook page confirms that the numbers you are looking at reflect a real account with real trades. It does not guarantee that the same results will repeat going forward. What it does give you is something screenshots and marketing claims cannot: a live, third party confirmed record you can check yourself, updated automatically, trade by trade.
That is the entire point of verification. Not certainty about the future, but honesty about the past.