There are many reasons as to why XauBot Pro has been able to maintain such a successful and profitable track record for so long with every single audit website and platform that keeps a record. It all goes back to the trading mechanisms that are employed by this intelligent automated trading tool that has been developed based on artificial intelligence.
Along with all the amazing features that it offers users, XauBot Pro is specifically focused on technical analysis by integrating indicators such as Bollinger bands, relative strength index, and also technical indicators from Apex. In this article we are going to take a look at the technical analysis side of XauBot Pro and also take a look at the indicators that it has integrated in order to offer such a precise level of technical analysis for the forex market.

Discover more: Strategies to Reduce Stress in Financial Markets
XauBot Pro and Its Technical Analysis Aspect
When you want to pick an automated trading tool, the first things that you check are its monthly profit records and also its drawdown values. In the case of XauBot Pro, if you take a look at its salient records, you can see that by being able to automatically trade all currency pairs in the forex market.
These are truly excellent numbers that any trader loves to see with their automated trading tool and that is exactly what you get with XauBot Pro. So how is XauBot Pro able to obtain such glowing figures?
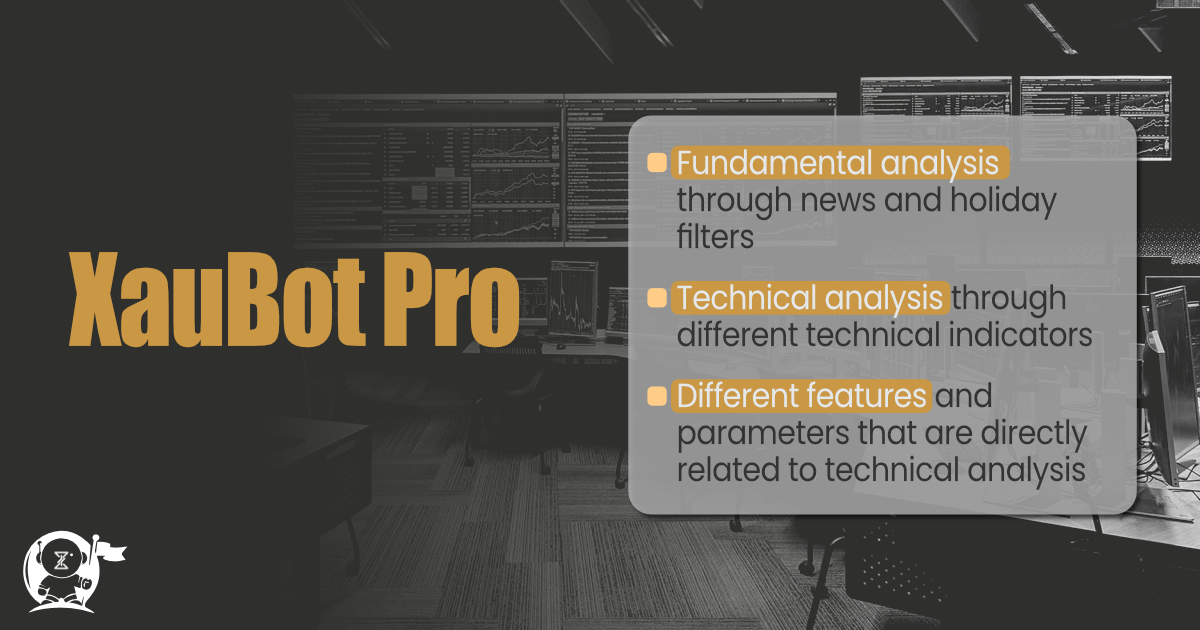
There are two main ways in which XauBot Pro is able to prove to be so beneficial. It has the two main types of analysis in place with all the relevant features and parameters that help them yield the best results.
For instance, it has fundamental analysis features such as news and holiday filters. But more importantly, it offers powerful technical analysis to users through the integration of useful and beneficial indicators, such as relative strength index, Bollinger bands, and also the indicators offered by Apex. Let’s take a look at each one of these separately to see how they work toward the success of the smart trading tool that is the XauBot Pro.

Discover more: Achieving Consistent Profits with XAUBOT PRO Trading Strategies
Bollinger Bands
There are many important factors that traders ought to keep in mind when they want to analyze the market. For instance they need to take into account the speed of price change, the volume of trades, and the amount of volatility, among others.
Measuring any factor can be difficult and involve too many figures and digits that can easily clutter your mind. But there are much easier ways that provide you with this information in an easily digestible visual manner.
One such method is the Bollinger bands, which provide you with an easy to understand visual representation of volatility in the forex market.
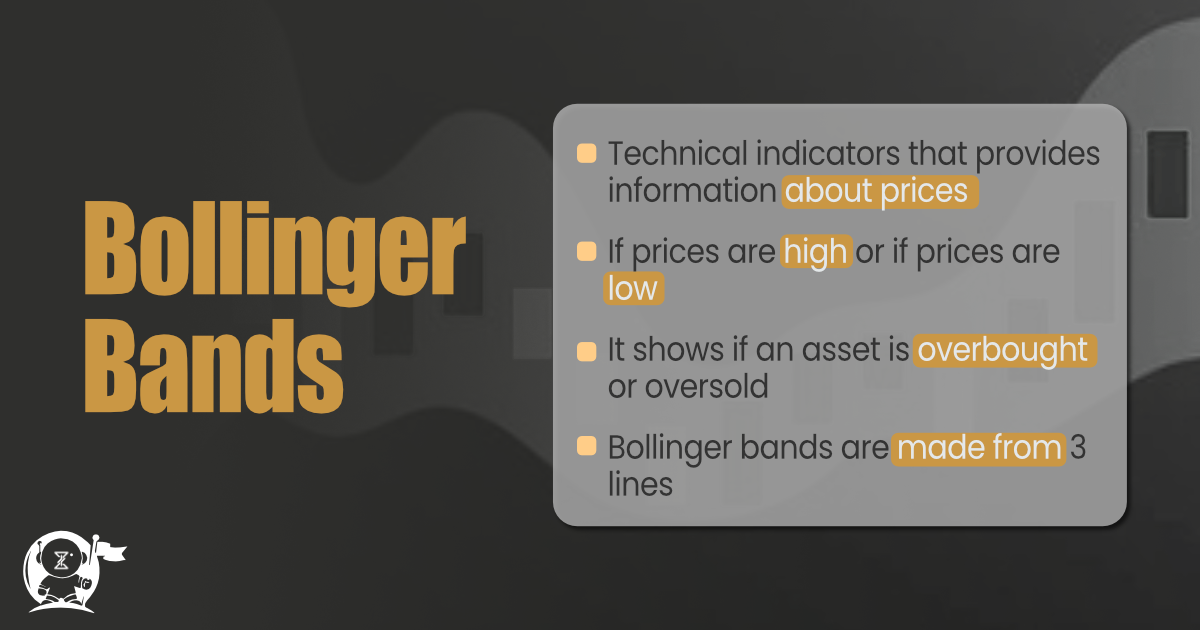
The way Bollinger bands work is by drawing up three lines on the chart. These three lines or bands from this indicator, where the middle line is a simple moving average. The two lines below and above this line are then used to measure the amount of volatility in the market.
The way it works is that if prices are closer to the upper band, then it indicates that prices are a bit high or the market is in an overbought state. On the other hand, if the prices are closer to the lower band, then it indicates a state of oversold where prices might be lower than what they should be. This is how Bollinger bands are able to provide extremely valuable information about prices in a very simple way.

Discover more: XAUBOT AI PRO Your Trusted Expert Advisor for Multi-Currency Trading
Relative Strength Index
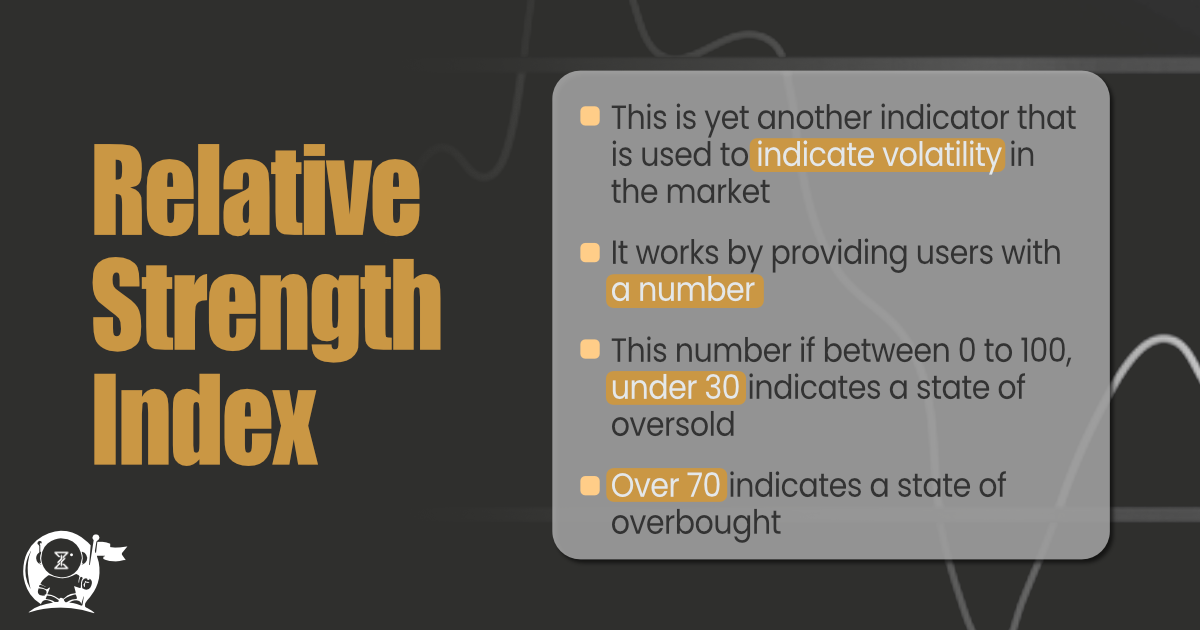
Here we have yet another technical indicator that is used to show us where the possible areas of overbought and oversold in the market are. It works in a simpler way by indicating a number between 0 and 100.
But how do you exactly interpret the numbers that are derived from this indicator? If the RSI figure is under 30, then it means the asset in question is in a state of oversold and prices are lower than what they should be. On the other hand, if the RSI number is above 70, then it means the asset is in a state of overbought and it is likely that prices are more than what they ought to be.
Similar to the Bollinger bands indicator that we discussed above, XauBot Pro also has an alert for the relative strength index or RSI.
Apex Indicators
Last but not least we have the Apex indicators that also play a crucial role in the technical analysis aspect of XauBot Pro and the success that it is able to bring users. This group of indicators are also analysis tools such as the relative strength index or the Bollinger bands that can be integrated into the trading chart.
It is through these technical analysis tools and indicators that users are able to get such consistent results and success with XauBot Pro and its AI-based features. These precise technical analysis approaches are what allow this automated trading tool to execute the best positions in the market. Technical analysis derives the most reliable patterns according to the price movements that occur and are registered on the chart.
Discover more: Exploring XAUBOT PRO’s Multi-Level Trading Strategy for Optimal Forex Performance
Conclusion
XauBot Pro is an intelligent automated trading tool that has been developed based on artificial intelligence and machine learning. Of course one of the major aspects of XauBot Pro are its significant technical analysis tools and methods. Among the technical analysis indicators and tools that are integrated into XauBot Pro are the Bollinger bands, relative strength index (RSI), and also the Apex indicators. All of the integrated tools and indicators are what help XauBot Pro to execute automatic trades in the forex market with the highest degree of precision.
