In the sea of technical analysis tools, there are those that stand out for many different reasons. The Fibonacci retracement is one of those tools that almost any trader has heard about, not least perhaps because of its distinct name after the well-known mathematician who discovered the Fibonacci sequence of numbers.
But aside from its fame and being well-known among traders, there are fewer who actually know how to use this tool to their advantage and execute it optimally. That is why in this article we are going to provide you with a step by step guide on what the Fibonacci retracement levels are and how you can execute this powerful tool to bring your forex trading to the next level.
What Is Fibonacci Retracement?
As we briefly mentioned in the introduction of this article, this technical analysis tool gets its name from the famous mathematician Fibonacci who came up with a sequence of numbers that came to be known as the Fibonacci sequence. In this sequence of numbers, each number is the sum of the previous two numbers coming before it.
We don’t actually use the literal numbers directly in forex trading, rather the levels or percentages to which they refer. Such levels are used in the forex market in order to find possible points where reversal of a trend or continuation of such trend can happen.
The ratios or levels related to the sequence of the Fibonacci numbers that are used in forex are as follows:
- 0.236 (23.6%)
- 0.382 (38.2%)
- 0.500 (50%)
- 0.618 (61.8%)
- 0.786 (78.6%)
You might wonder how these numbers are obtained? The way these ratios are obtained is through dividing the Fibonacci number itself with its inverse. This way we would get a decimal number, as you can see above, which can of course be presented as a percentage.
So, now the question is what are these percentages? Because this question is very important in understanding Fibonacci levels in forex, we have dedicated a short but separate section to it.
What Do the Levels in Fibonacci Levels Represent?
The numbers themselves do not mean anything on their own. But they have a special meaning attached to them in the forex market. The reason the Fibonacci sequence of numbers are turned into ratios and also percentages in forex trading has to do with retracement.
This is by the way why we call them Fibonacci retracement levels. When there is a trend in the forex market, this also extends to other financial markets, and prices are moving in a certain direction, it is highly likely that they will retrace to a previous level. This retracement is more often than not in the percentage that conforms to the percentages derived from the Fibonacci numbers, which range from around 23% to 78%.
After they retrace, they will either continue in their direction or even change direction and head for reversal. No matter what happens, if you know the direction, you can take advantage of it. And this is exactly what Fibonacci retracement levels will tell you. Now let’s see how you can actually execute and use this tool.
Step 1: Understand the Trend
Obviously, retracement takes place to a level where prices were previously. So whether we have an uptrend or a downtrend, retracements would be the exact opposite of each other. This is very easy to understand.
In an uptrend, retracement levels would be swing lows and then back up.
In a downtrend, retracement levels would be swing highs and then down again.
So before you begin using the Fibonacci Retracement in forex, the trend ought to be identified.
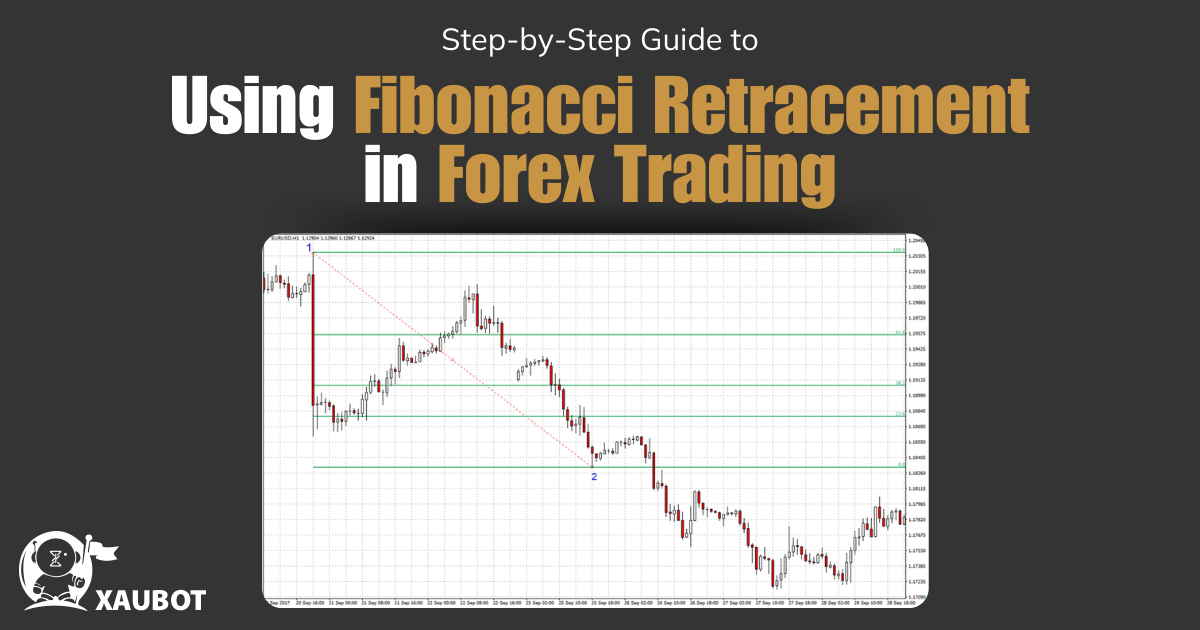
Step 2: Apply Fibonacci Retracement Levels
After the overall trend is identified, you need to actually apply the levels onto the chart. This is easy because popular trading platforms such as MetaTrader or TradingView have already built-in tools that allow you to do such a thing. So you only need to go to the toolbar and choose the Fibonacci retracement tool.

Now because you have already identified the trend, now you only need to pick the most recent swings (whether high or low or vice versa depending on the trend) and click on them. Choose as many as you can and drag from the most recent to the one you want.
Then the tool will automatically display the Fibonacci retracement levels on the chart for you.
Step 3: Analyze the Levels
As you can see so far it is quite easy to choose the tool for Fibonacci retracement and applying it to your chart to obtain the levels regarding the current trend. After the levels are obtained, it is time to actually analyze them to see what they mean.
So given the percentages or levels that are shown to you, what do they really mean after all?
- 23.6% and 38.2% Levels: these are called shallow retracements. As the numbers indicate, these are small and not so strong retracements. These occur when there is a strong trend in the market. And because the trend is strong, it is not really affected by these retracement levels and it will continue in the same direction after them.
- 50% Level: it might be interesting to know that this ratio is technically not part of the Fibonacci ratios. However, it is still used as a middle point that can be used to see where price consolidation can take place.
- 61.8% Level: now we have surpassed the middle point. This level is also known as the golden ratio. Of course it is a strong retracement and this is where we would more often than not expect a sharp reversal in the trend.
- 78.6% Level: this is where we get to quite deep retracement. By this point you can probably guess what will happen after this level. Because this retracement is very strong and quite deep, you can expect a significant reversal in the trend.
Do Not Forget to Use Other Tools and Indicators

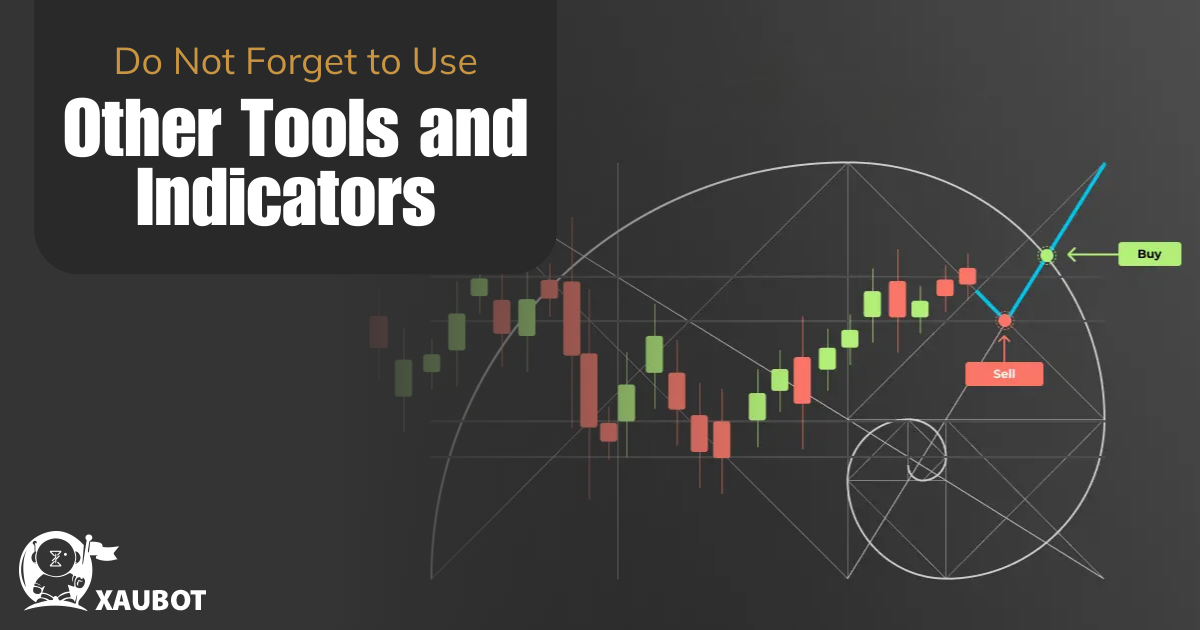
As a general rule, always remember that relying on a sole tool or indicator can be risky. This is because while a tool or indicator can be quite strong and reliable, the market is an extremely complex phenomenon. This is why it is always recommended to use indicators in conjunction with each other in order to obtain confirmation about a result that you have found out.
In the case of the Fibonacci retracement, you can use various indicators that can confirm your analysis. You can of instance use various moving averages in order to confirm the direction of the trend that is predominant in the market and also find out areas of support and resistance. Or you can use different candlestick patterns in order to help you confirm reversal patterns that are close to the analysis you have obtained through Fibonacci retracement levels. These are just two examples. You can use any tool that can help you confirm that result you have obtained.
Conclusion
There are certain rules in the world that we can see almost everywhere. This is true about the sequence of numbers known as Fibonacci, names of course after the well-known mathematician who came up with them. These numbers are also used in trading in the form of Fibonacci retracement levels. They can provide invaluable information to traders about potential reversals or continuation of the predominant trend in the market.
