In a previous article we have covered the tweezer bottom. Now is the turn for its sibling, the tweezer top candlestick pattern.

Forex traders, and indeed all traders, have always been looking for more appealing and straightforward manners of representing market data, such that they would be easy to read, understand, and analyze for the purpose of making predictions.
Candlestick charts are perhaps among the most popular methods of charting in all financial markets. and they are not a modern idea by any means. In fact, they have been put in practice by Japanese merchants over 300 years ago.
With the help of these charts we can represent price movements and daily changes in the market with the help of candlesticks. There are numerous shapes and patterns that are formed with the help of these candlesticks. One group of patterns are known as tweezer patterns. As we said, the focus of this article is the tweezer top candlestick pattern, its definition, process of identification, meaning, and application in the forex market.
Candlestick Patterns as Trend Indicators
An important group of technical indicators are those that can provide information with regard to market trend or market momentum similarly. The reason such indicators are very important has to do with the trading strategies that are based on trend trading.
There are also candlestick patterns that are used to offer data with regard to market trend and the overall momentum in the market. These types of indicators are predominantly based on user and trader sentiment.
And that is exactly one of the main advantages of candlestick charting. Even when it was originally developed in Japan hundreds of years ago, it was done so with this perspective in mind that the tendency or sentiment of a large enough group of traders can shift the status of the market.
For this reason, the major use case of candlestick patterns is the identification and detection of trends or their reversals. Tweezer top and bottom are also both trend indicators – or rather trend reversal indicators.
Tweezer bottom is a bullish reversal indicator and the tweezer top is a bearish reversal indicator, both of which can be crucially beneficial and useful for forex traders – especially those who rely on market trend and momentum for their trades.
What Exactly Is a Tweezer Top Pattern?
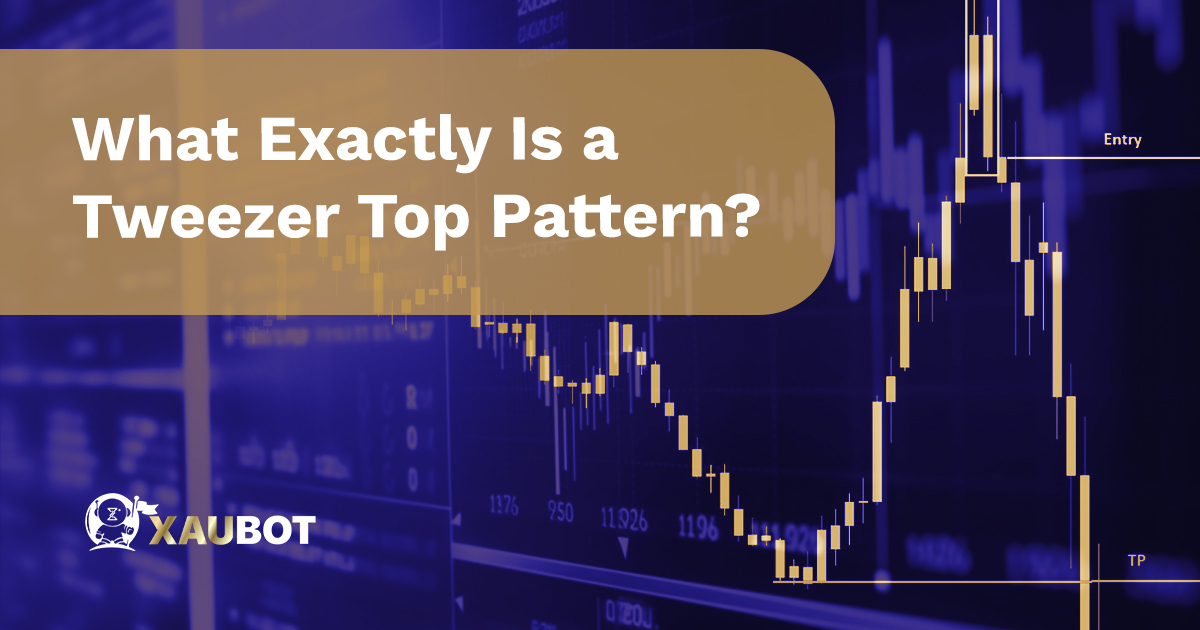
What Exactly Is a Tweezer Top Pattern?
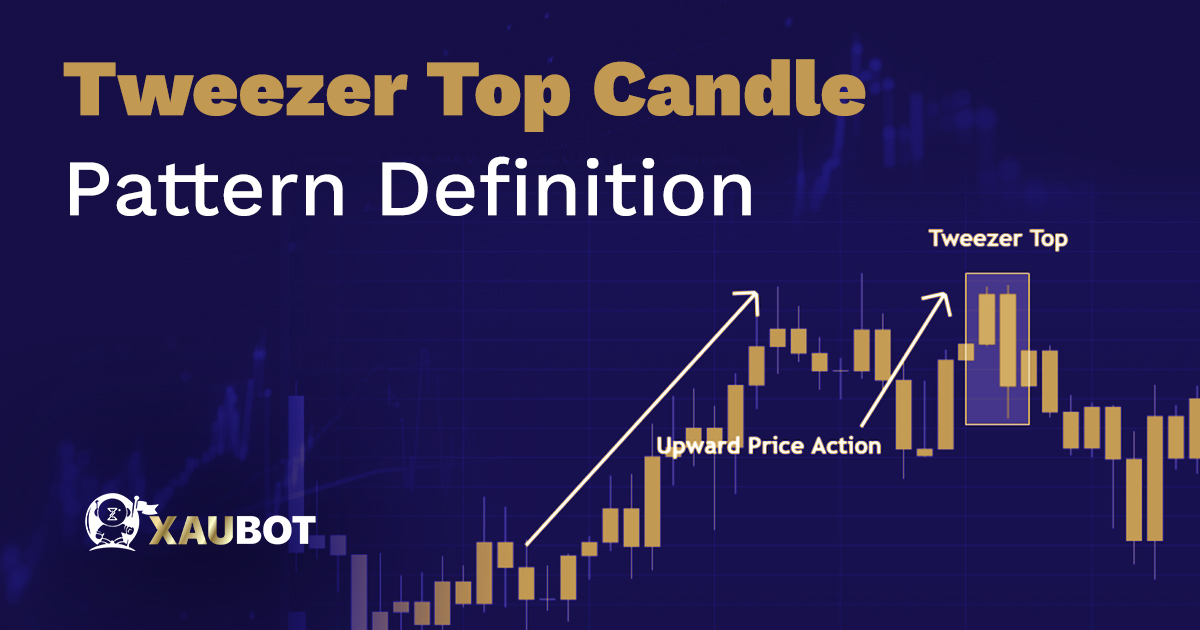
A tweezer top is a double candlestick pattern. This means there are two candle shapes or candlesticks that make up the pattern.
Remember that in the previous section we mentioned the tweezer top is a bearish reversal sign. Because of this reason, it needs to take form when there is already a bullish trend or uptrend in the market. After all, the tweezer top is going to be the sign that the market trend is going to reverse toward the bearish area.
Therefore, the first candle that is registered in this pattern ought to be a green candle. Because there already was an uptrend in the market. And remember, trends and market momentums do not just change in the blink of an eye.
And although the first candle is a green candle, it does normally have a medium to even long lower wick. It means while the closing price of the candle is higher than its opening price, therefore being a green candle, it does register some really low prices – at least compared to the existing uptrend.
This is where we would see a lower wick for the candle, which is a sign that there is a push being formed toward lower prices.
After the first candle, it is the turn for the second candle. The second candlestick in the tweezer top pattern is a red or bearish candlestick – hence the bearish reversal pattern.
But because the second candle is bearish, it means the closing price is much lower than its opening price.
But at the same time, being a tweezer top pattern, the tops of the two candlesticks align with each other – meaning that the closing price of the first candlestick matches with the opening price of the second candlestick.
What Does the Tweezer Top Mean?
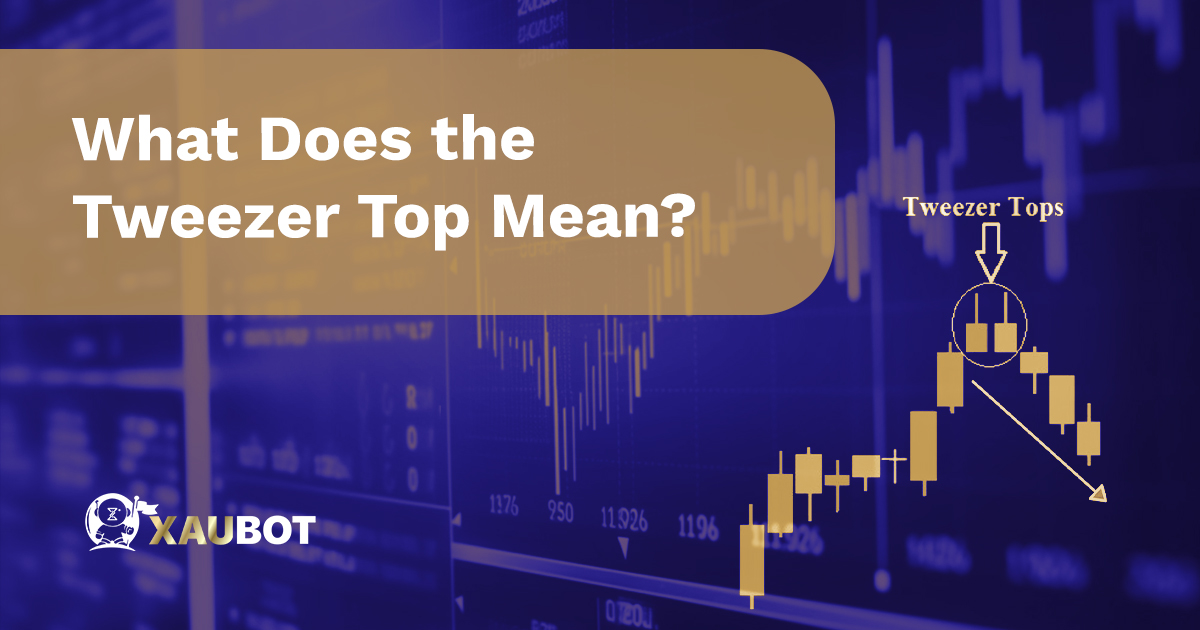
What Does the Tweezer Top Mean?
The tweezer top is a bearish reversal signal. It means when it is detected and identified correctly on the market chart, then traders can potentially expect a reversal in the existing bullish trend toward the bearish area.
Reversal signals are crucially important because if you are not able to detect the reversal of the current trend and momentum, you will be swept and taken under by the next trend.
So if you are trading the trend or “riding” the trend, make sure to look out for any signs that the trend might come to an end. You need an exit strategy for such an event and also an adjustment in your overall trading approach to make it suitable for the new trend.
How Can You Identify Tweezer Top?
There are a number of factors to keep in mind when you want to identify the tweezer top pattern.
First of all, the tweezer top must be detected when there is already an uptrend in the market. It would normally be expected when the uptrend is nearing its end.
This is true for all candlestick patterns. If the place of formation does not match the requirements of that specific candlestick pattern, then it is not what you think it is.
Furthermore, you need to make sure that the two candlesticks align with each other from the top. In addition, the second candlestick, i.e. the bearish candlestick, can be bigger and longer than the first green candlestick.
In fact, the longer the second candlestick, the higher the chances of a bearish reversal.
Applying Tweezer Top to the Forex Market

Applying Tweezer Top to the Forex Market
There are two aspects you need to keep in mind when you want to apply this pattern to the forex market.
If and when while trading and reading the charts, you come across this pattern, then first of all, you need to make sure that the specifications of this pattern are correct – i.e. the top alignment, the correct succession of green (bullish) and red (bearish) candlesticks.
If all the criteria are checked, you can prepare yourself and your trading strategy for the upcoming change in the trend.
Furthermore, just like other patterns and technical indicators, you need to find other indicators and traces that can provide assurance and confirmation for the original tweezer top pattern.


1 Comment
I appreciate you sharing this blog post. Thanks Again. Cool.