Hanging man is not just the name of a popular game you used to play when you were a kid, it is also the name of a simple but useful candle pattern that can be used in forex trading. Much like all other candle patterns, the hanging man is Japanese by ethnicity!

The Japanese trading tradition has left quite an impressionable mark on all financial markets, including our go-to choice for trading the one and all, the foreign exchange market or forex.
This deep and lasting impression is seen in the form of the charting approach known as candlestick charting, wherein candle shapes, or candlesticks, are used to draw up charts.
And with this charting approach comes the extensive method of technical analysis that consists of countless candlestick patterns. We are going to dedicate this article to the ever simple hanging man pattern, discuss its definition, detection, features, and application in forex trading.
Single Candle Patterns
You might have noticed that in the intro, we referred to the hanging man pattern as “simple” a number of times. But why?
The reason is that there is a group of candlestick patterns that are made from only one candle, hence called single candle patterns. These patterns are infinitely simple in their formation and shape, but just as infinitely they can be useful and practical.
Of course, because of their simplicity, these patterns are very easy to detect. But at the same time, there might be some confusion with regard to correct detection. There are a number of factors involved with these patterns, including the features of the candle itself and also the place of formation.
So let’s see what the hanging man exactly is and how you can correctly identify and use this candlestick pattern.
Hanging Man Pattern: A Definition
Hanging Man Pattern A Definition
The hanging man is a single candle pattern that is used to signal a bearish reversal in the market. When a candle pattern is known to be a bearish reversal, then it is normally seen and detected during an uptrend, or especially near the end of an uptrend.
The hanging man pattern is a rather strong indication that the momentum of bulls in the market is running low and it is near its end. So the hanging man provides forex traders with a signal that prices are quite close to a sharp drop.
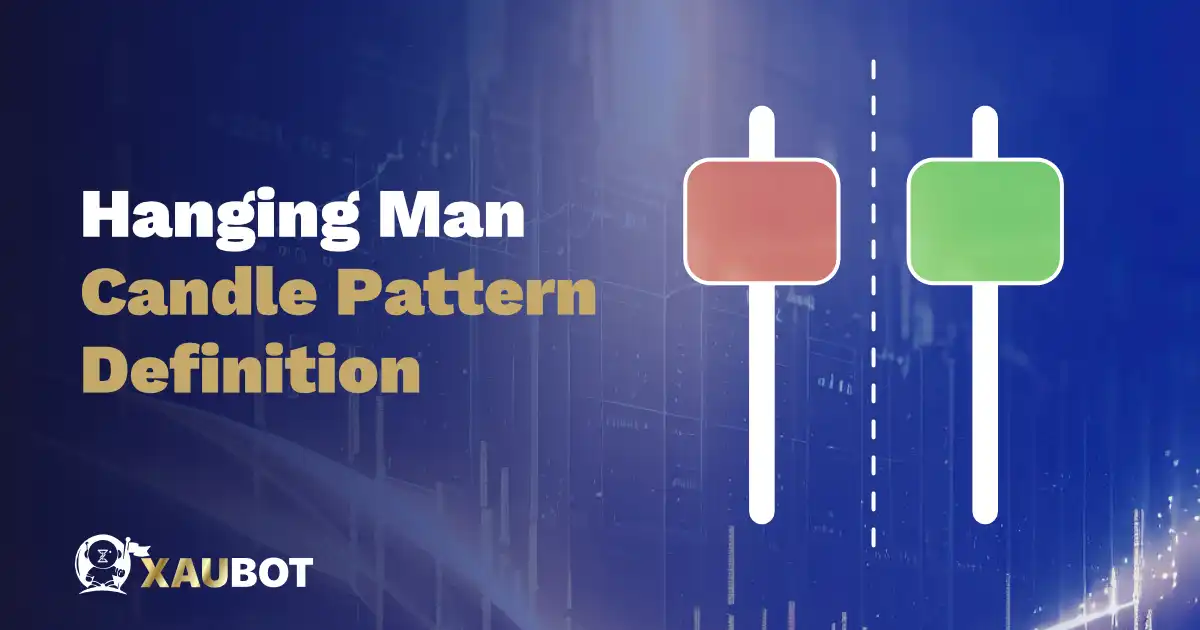
The pattern itself is made from a single and very small body. The small body of this candle indicates that the opening and closing prices of this candlestick are close to each other. So this does not provide much data for traders to work with.
The real crux of the pattern lies within the shadows or wicks of the candle. The hanging man does not have an upper wick or shadow. Or even if it does it is very small.
This clearly indicates that there is not much push toward higher prices. So the bulls have been pushing higher and higher, but they are running out of fuel. This is why a hanging man is not able to register a long upper wick.
Now the most important piece of data is seen in the lower wick of the candle. The hanging man pattern has a long lower shadow. This means there was a great push for prices to move downward. Therefore, during the formation of the candle, lower and lower prices are registered, hence forming the long lower shadow.
When Is a Hanging Man Pattern Expected?
As we mentioned above, the place of formation is quite important for any candle pattern. While the features of the pattern itself are also crucial, traders must not overlook the locale!
In fact, the location of the pattern on the chart can mean the difference between two completely different candle patterns. So where is a hanging man pattern usually detected?
First of all, because this pattern is a bearish reversal, then it is usually seen at the top of an uptrend. This is when the uptrend is running out of gas and the market is ready for a bearish turn.
So, when the pattern is detected during such a trend in the market, you need to look for other indications.
Identifying a Hanging Man Candlestick Pattern
Identifying a Hanging Man Candlestick Pattern
So, we discussed the chart location of the pattern. After that part is confirmed by the trader, there are other signs to look for in order to confirm the identification of this candlestick pattern.
First of all, there is the small upper wick. This means, while the candle pattern is not able to record a higher high during its formation, the small upper wick is indicative of the last ditch efforts of the bulls in the market to push forward and upward, but in vain.
The body of this candlestick pattern can be green (also sometimes white) or red. This does not play out much in the final analysis of the pattern. In either case the pattern is a bearish reversal. But the color of the body indicates whether the existing sentiment in the market is bearish or bullish. It also depends on the small differences between opening and closing prices.
And lastly, the most important sign is of course the long lower shadow. This lower wick or shadow means there is a powerful push to sell, or at least a desire to do so. This is where we can see the initial formation of a strong bearish sentiment in the market.
Though, it is not fully formed, hence the closing price is much higher than the low prices recorded for the candle. Nonetheless, the powerful push downward is the sign of signal that the bearish reversal is in the offing.
Trading in Forex with Hanging Man Candle Pattern
There are different signs of confirmation that can help forex traders rely upon candle patterns in their trades. In the case of the hanging man, you need to first and foremost go through the checklist of identification criteria we provided above.
After you have made sure all the items are ticked, then you can look closer at this pattern. The long lower wick is key here. In fact, the longer the better.
Once you identify this pattern during an uptrend, you can adjust your trading approach and your open positions with the newfound information.
Naturally, the hanging man should be evidence enough that your long positions might be better off left aside for some other time. In fact, as the market is ready for a reversal, so should your positions be.
This is a good time to consider shorting the currency pair you are trading in the forex market. Indeed, if you catch this pattern soon enough, you will be able to protect your assets to a great extent.
Conclusion
The hanging man candle is a simple candlestick pattern and it is counted among the single candle pattern. While formed with only one candlestick, the hanging man can provide valuable information. This candle pattern is a bearish reversal and is usually seen near the end of an uptrend and indicates a powerful push to sell.

