There are many features one can consider as the particulars for the foreign exchange market (Money Flow). For instance its decentralized nature and the stupendous and tremendous amount of money that comes in and goes out of this market as part of its daily trading volume.
But there is another peculiar feature that is seen too often and just one too many at every occasion, and that is the volatility that this market experiences or rather imposes upon the traders.
According to this market behavior, it takes a very aware and smart trader to not get swept away by these sudden changes. It is for this reason that you should be equipped and ready to handle these market volatilities. One way to do this is to use indicators such as the money flow index or MFI. In this article we are going to see how you can use the money flow index and the money flow limit feature of XauBot Pro to tackle this particular challenge.

Take a look: Unraveling the Secrets of XAUBOT’s Fundamental Analysis Approach
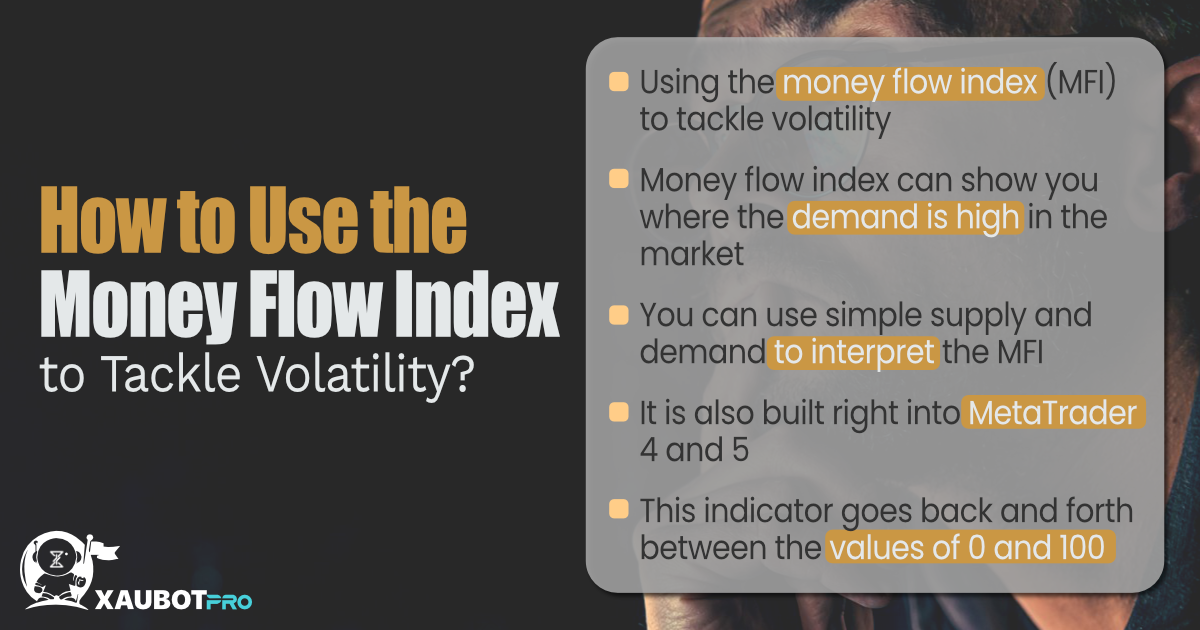
How to Use the Money Flow Index to Tackle Volatility?
As we mentioned in the intro, one of the ways that you can use in order to handle the volatility in the foreign exchange market is to use various technical indicators and technical tools that can help you deal with such events in the market.
There are many such indicators, but perhaps one of the best ones is the money flow index otherwise also known as MFI.
As the name suggests, the money flow index is an index for the flow of money and capital in any financial market. It was originally developed for the stock market, but it can also be used in various other financial markets.
The money flows index basically tracks where the users or traders are taking their money in the market and thus it can show you where the most flow of the money is. This has huge and important consequences for all assets involved.
On the face of it, the money flow index is a simple indicator for supply and demand. But mostly for demand as it is used to indicate the money flow. So with the help of this indicator you can see whether traders are interested in an asset or not and how much their interest or disinterest is.
Then based on simple supply and demand concepts, you can interpret the information that this technical indicator can provide for you. Naturally, if the MFI is indicative of a lot of traders focusing on, for instance, only buying a certain asset or trading pair in the forex market, then it clearly shows the high degree of demand for that asset or trading pair.
On the other hand, if the MFI indicates a low flow of money toward a certain trading pair and a certain position, then you can also interpret that there is low demand for that particular asset.
But there are better ways for interpreting the information that is obtained through this technical indicator. First of all, you need to know that the MFI provides traders with a number or a value. Since it is an oscillator, it goes back and forth between two values of 0 and 100.
Therefore the number that it is showing will be used to interpret the final result with respect to money flow in that specific market. The general rule about this indicator dictates that a value under 20 or 10 is describing a condition where an asset is being oversold, i.e. traders are flowing their money toward shorting the asset in question. On the other hand, if the value for MFI shows a number higher than 80 or 90 then it means the trading pair in the forex market is being overbought, which means traders are pouring their money into long positions with respect to that pair.
This is how you can use the money flow index to find out about where the money in the market is going and thus be able to predict the volatilities associated with that particular move. In fact, with the money flow index not only will you be able to predict them, you will also be able to benefit from them.
It is also worth mentioning that this technical oscillator or indicator is built right into the popular trading platforms MetaTrader 4 and MetaTrader 5.

Take a look: Utilize Telegram Messages for RSI and Bollinger Band in XAUBOT Pro
Can XauBot Pro Help You Manage Volatility in Forex?
XauBot Pro purports to be an intelligent and automated trading tool that can take care of all the trading needs and requirements of users in the foreign exchange market.
Among the most important premises and features that it boasts itself on having is a seriously powerful and precise risk management apparatus. Controlling and managing risk in the forex market will ultimately also mean controlling and managing the sudden and often small price changes that occur in this market – i.e. the volatilities.
As a result, many features have been integrated into this trading tool to combat such volatilities. We are going to focus on one of these parameters that is known as money flow limit. As the name of this parameter suggests, it is directly related to the money flow index indicator.
So how does this feature work?
The way it works is that it allows users to define thresholds for the money flow index and then receive alerts based on the limits they had defined for it. So for instance, if the limits that you define for this indicator are the extremes that get close to the initial and final 10 in the threshold of 0 and 100, you will receive an alarm when that threshold is passed or hit.
This way you will never be caught off-guard by what is going on in the market.

Take a look: Significance of Money Flow Limits in Trading in XAUBOT Pro
Conclusion
In this article we discussed the role of the money flow index technical indicator which is also a technical oscillator which is used to find out the flow of money and also which areas in the market are overbought or oversold. We also discussed a particular feature of XauBot Pro that lets you set thresholds for the money flow index and receive alarms when those thresholds are passed or hit and so in this way you can make decisions about your positions in the market.
