
The most important task of any trader with respect to market analysis is technical analysis. In technical analysis we have indicators that are used to derive information from existing patterns in price movements in order to be able to predict possible future movements.

Two of the most important technical indicators in the forex market are the relative strength index or RSI and also the Bollinger band indicator. In this article we are going to take a look at each of these indicators individually to see what valuable information they can bring for you as a trader.
But most importantly we are going to take a look at a specific feature integrated into XauBot Pro that allows you to implement these indicators in the best way possible through relieving messages in your own personal Telegram account. 
Take a look at: How XAUBOT PRO Integrates Bollinger Bands, RSI, and Apex for Success
Looking at the Relative Strength Index or RSI
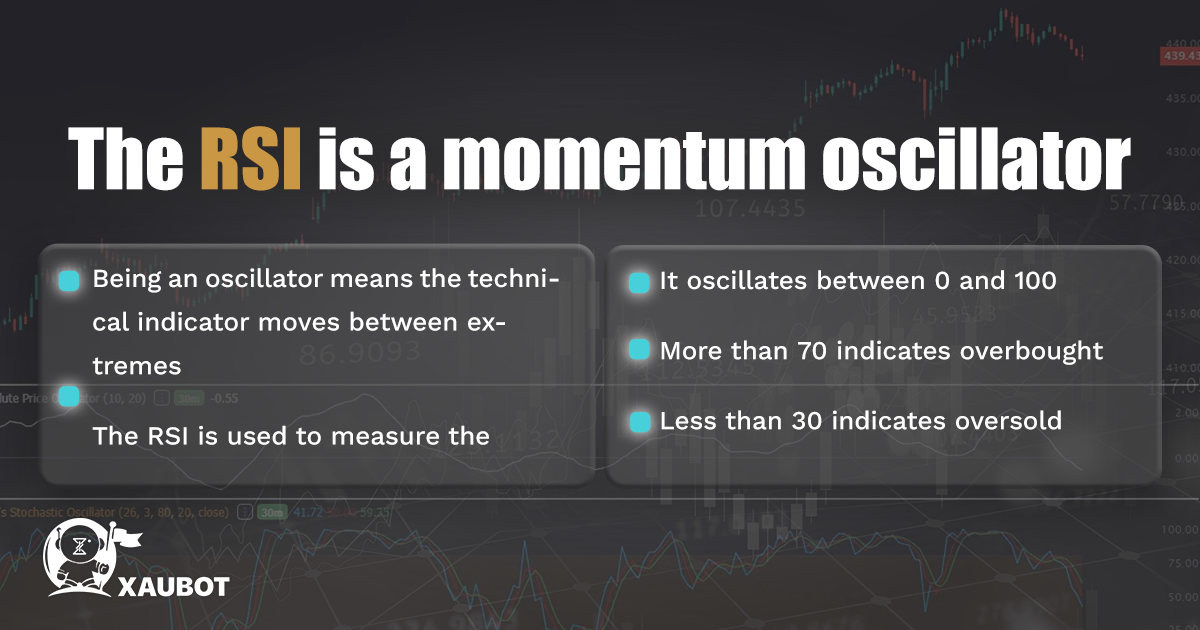
The relative strength index is one of the most widely applied technical indicators across all markets, including the forex market. This indicator is used to measure the momentum in the forex market. As a result it is regarded as one of the most important momentum indicators among all technical indicators.
But what exactly is market momentum? Well, in the case of the relative strength index, when it is stated that this indicator measures market momentum, it means it is used to gauge the speed of price change and price movement in the market. This is why it is said to measure the momentum, i.e. the force of the price change that currently exists in the market.
Other than being a momentum indicator, we also mentioned that it is a momentum oscillator. The whole class of oscillators in technical analysis are indicators that go back and forth between two extremes or two thresholds in order to provide us with an evaluation of the market status with regard to their own function.
So for instance the relative strength index oscillates between two values of 0 and 100 which also make up the two extremes between which this technical indicator oscillates back and forth.
So at any one point the RSI will be somewhere between these two values and its exact position will define the information that it is conveying to traders.
So how do we interpret this information based on the value of the RSI? The way it works is that any value above 70 indicates a state of overbought in the market and any value below 30 will indicate a state of oversold in the market.
Naturally these are extremely important pieces of information as traders can use them to make decisions with respect to their positions, as to whether to go long or short.
Let’s look at the Bollinger bands indicator before discussing the features of XauBot Pro for both of these technical tools.
Take a look at: XAUBOT PRO the Game-Changing Scalp Strategy Unveiled
What Information Can Bollinger Bands Provide for You?
Bollinger bands are another type of technical indicator that are used by XauBot Pro as part of its approach to technical analysis in providing the most accurate and reliable automated trading decisions for users.
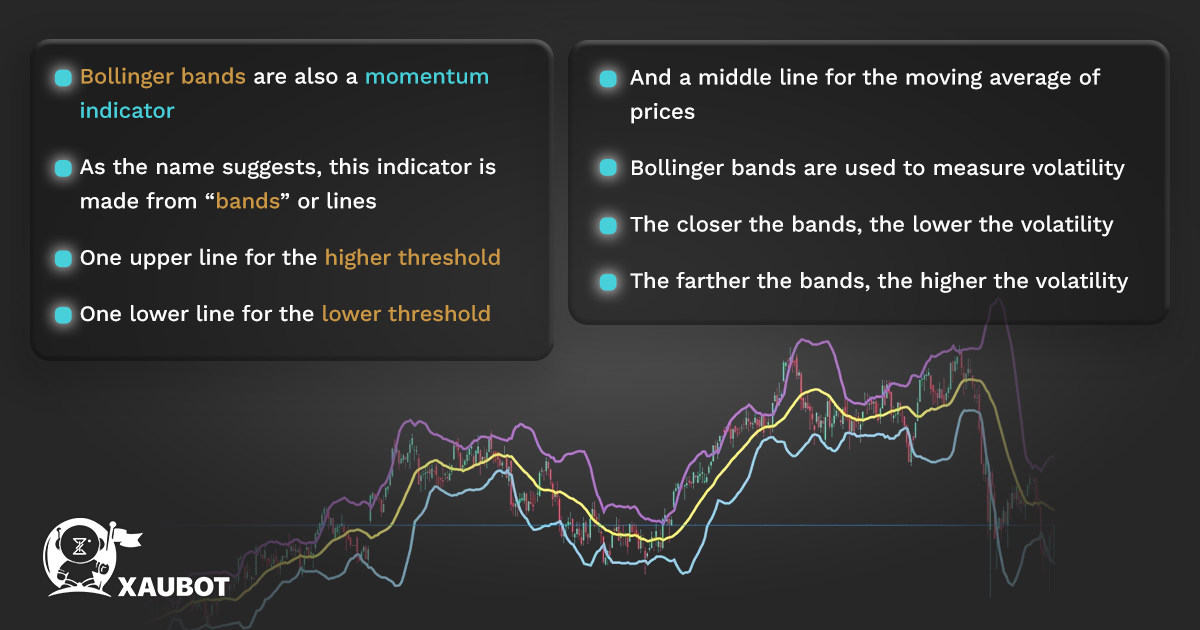
Similar to the RSI, the Bollinger bands are also a momentum indicator. This means they are also used to measure the price changes or volatility that is taking place in the market.
As the name suggests, the Bollinger bands are from bands or lines that together make up the totality of this technical indicator. In fact, three bands or three lines are used in the making of this technical indicator.
Let’s take a look at these three lines one by one to understand this indicator all the better.
- Upper band: this is of course the higher threshold of this indicator which is normally two standard deviations higher than the middle line which is itself the moving average line.
- Lower band: this, on the other hand, is the lower threshold or the lower limit of this momentum indicator which is also two standard deviations below the middle band.
- Middle band: and of course the middle band itself which is the moving average line and considered the most important line in this indicator.
As we said, the Bollinger bands are used to evaluate volatility in the market. So we need to take a look at the way we can interpret them. At any one point in the market, the closer these three lines are together, it means the moving average is close to both of the lower and upper thresholds, so it means there is low volatility in the market.
However, if at any given point, the distance between these three bands is a lot, then it indicates room for a lot of price change or volatility, so it means there is a lot of volatility in the market.
Take a look at: Maximizing Forex Profits: A Guide to Using XAUBOT’s Scalp Strategy
Telegram Messages for RSI and Bollinger Bands: XauBot Pro’s Advanced Technical Analysis Features
So we saw how the RSI and the Bollinger bands indicators work and how you can use them to the benefit of your trading process in the forex market. But the thing is that we do not always have the chance to make a move as fast as possible.
If there is a delay between the time we receive or obtain a certain information and the time we act upon it, then chances are things have already changed in the market.
This is why XauBot Pro has a Telegram notification feature for many of its parameters, including of course the RSI and the Bollinger bands technical indicators.
According to this feature, you will receive messages in your own Telegram account for the positions of RSI and Bollinger bands whenever a buy or sell position presents itself.
Take a look at: Filtering Out Noise How XAUBOT’s Advanced News Filter by trading tools
Conclusion
In this article we took a look at two of the most important technical indicators that are used in the forex market and also as part of the technical analysis approach of XauBot Pro. We also took a look at the feature of XauBot Pro for these two indicators, whereby you can receive messages and alerts in your Telegram account.

