Trend trading is kind of like being a really smart and professional surfer who knows when a good wave is coming and more importantly which wave is going to last long enough to surf on. And yes it could be as fun as actual surfing!

But it cuts both ways. If you misidentify a wave, you will just fall and be submerged in the chaotic water that is the forex market.
So in order to be a good forex trend trader, you need to have a perfect understanding of what trend trading is, and what strategies or techniques are required to carry out the perfect trade in this style.
What Is Trend Trading in Forex?
In trend trading, forex traders utilize any number of technical analysis tools and technical indicators in order to find out what is the general momentum or trend of the market.
In attempting to identify the general momentum, forex traders may rely on what is upcoming in the market, in addition to present conditions and even past price movements and market patterns.
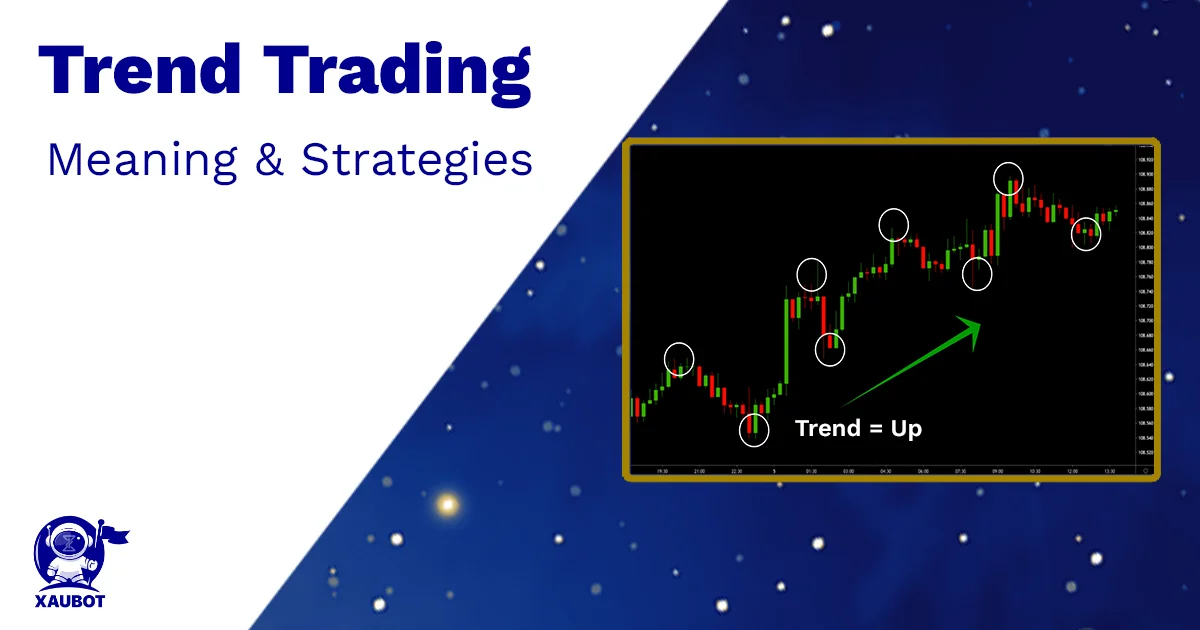
The whole idea of trend trading relies upon the notion that the price of a trading pair might move along a certain pattern that can be predicted. When this general pattern of movement is identified then the forex trader can “ride” the trend.
So the ideal situation in this type of trading is when the forex trader identifies the trend at the right time to enter it and also picks the right time to hop off before it breaks toward an unfavorable trajectory.
Of course, as you can guess, it is not the easiest job for a trader to properly predict these trends, as the market can change even at any second. So let’s see what strategies and methods can be employed for a dependable pattern detection for any forex trading pair.
What Strategies Can Be Used in Forex Trend Trading?

what strategies can be used in forex trading?
Before discussing the strategies and technical indicators that are mainly used in trend trading, it needs to be mentioned that the main aim of all strategies and analysis methods here is to predict and identify the trend with a high degree of precision.
With that said, there are many different kinds of strategies that are used in this style of trading. Each one of these strategies uses different technical indicators. Because in trend trading, forex traders are depending upon the general behavior of the market and that could be very unpredictable at times, using a stop loss limit is always advised for increased loss and risk management.
We are going to take a look at how stop loss ought to be used in trend trading regardless of strategy and also the different strategies that are implemented.
How to Use Stop Loss in Trend Trading?
Specifying the correct stop loss is one of the most crucial and fundamental steps in any style or strategy of trading. The way placing a stop loss works in trend trading depends upon the trend itself.
If the market trend and momentum is upward, then the stop loss limit should be placed at the lowest low before entering or jumping on the trend. So when the uptrend is detected and the forex trader decides to ride this trend, wherever the most recent swing low is that is where the stop loss should be placed – i.e. the most recent support line before entering the trade. Because when riding an uptrend, the ordinary position of a forex trader would be a long position.
On the other hand, if the detected trend is a downtrend, then the stop loss limit should be placed at the most recent high before hopping on the trend. This means the latest resistance line should be picked as the stop loss for the downtrend. And contrary to the uptrend, when riding a downtrend, the ordinary position would be a short one.
Using Moving Averages for Trend Trading

using moving average for trend trading
Of course in this strategy of trend trading, the trader utilizes the moving average lines in order to make a decision with regard to which position to take.
A long position is recommended when the short term line of moving average goes over the long term moving average line. On the other hand, a short position is recommended when the short term line of moving average slips below the long term moving average line.
On the other hand, a general moving average line can also be useful to detect the general trend. Naturally, in this case, when prices go over the moving average line then it is signaling an uptrend, during which the trader is recommended to take a long position. And when prices move below the moving average line, then it is normally indicative of a downtrend where the trader should take a short position.
Various other technical indicators might also be used along with moving averages. Because at times when no specific trend is present in the market then we merely have price swings between moving average lines, which clearly do not point toward a certain trend.
Indicators that Identify the Market Momentum
Although there might be many indicators that can help traders identify the market momentum, one particular indicator that does the job quite well is the relative strength index or RSI.
Of course, the percentage of RSI (on a scale of 0 to 100) indicates whether the trading pair is overbought (RSI>70%) or it is oversold (RSI<30%).
So how are these figures translated into useful data for trend trading? Forex traders use these numbers as indications for when a trend becomes mature and another one is about to begin. Although, it is worth mentioning that at times it is possible for a trend to remain in its overbought or oversold state for prolonged time frames.
Trend Trading Based on Trend Strength
Of course it is also important how strong a certain trend is. Because if you want to ride that trend long enough to first profit and second avoid losses, the trend needs to be strong enough to hold your “surfing board.”
The index used to measure trend strength is the average directional index otherwise known as ADX.
Similar to RSI, ADX also oscillates between 0 to 100. But this time, ADX is actually a bit easier to interpret. Basically, however high ADX is it means the trend is stronger. So for example, an ADX of 70 would naturally mean that the trend is quite powerful.
Conclusion
Trend trading is one of the most popular methods and styles of trading in forex. In this style of trading, forex traders get help from technical indicators and analysis tools in order to determine what the momentum of the market is.
Contrary to other trading styles, such as scalping which takes place on a much shorter time frame, trend trading is considered to be a mid to long range with regard to the time frame of trading.
Various strategies are used in this method of trading in order to identify a trend when it is early in its formation and also to determine when the trend might hit a stop.
As discussed above, the most widely used technical indicators for trend trading strategies are the moving averages, relative strength index, and of course the average directional index.
Similar to other forms of trading, it is always better to test it out fully in a demo account. Because in trend trading, since the goal is to identify the comprehensive market trend and momentum, many factors ought to be considered, which can be easily overlooked. But if practiced enough, trend trading can be one of the best and most lucrative styles of trading in the forex markets.

