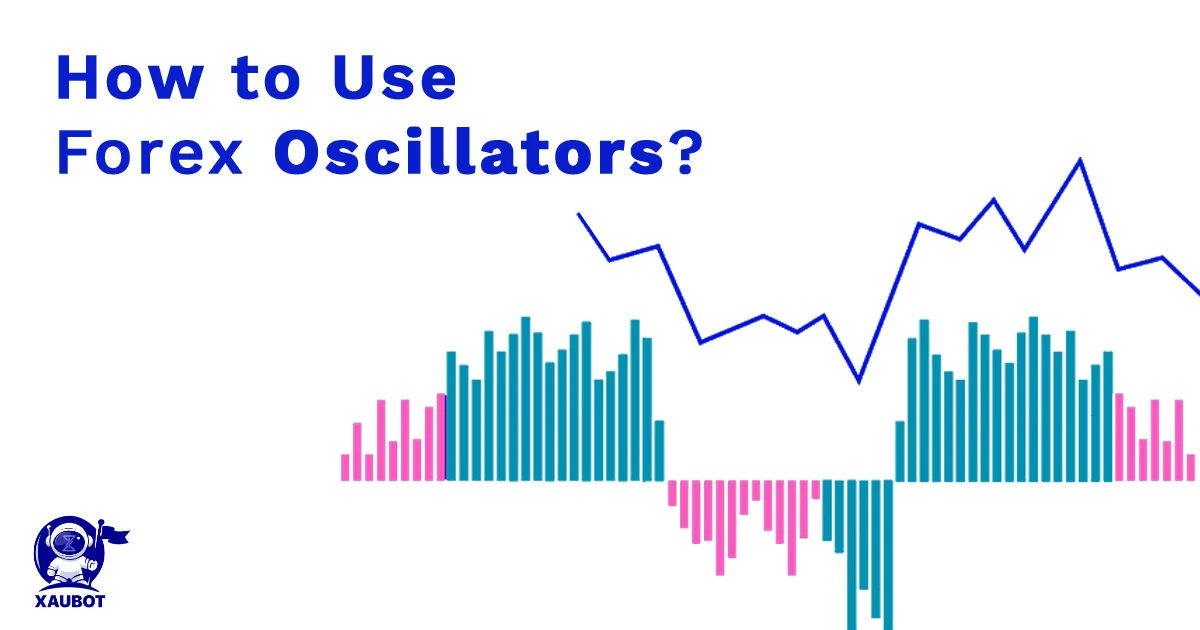
There are many technical indicators that ought to be learned by heart in order to have a successful trading experience in the forex market. Different technical indicators can provide traders with various information regarding the market movements and price changes.

Among these indicators some of them are more widely applied and more popular. Oscillators are such indicators. In fact, they get their name from what they do or rather what they represent to traders – i.e. oscillations.
An oscillator will go back and forth between two figures, two lines, two thresholds, etc., depending on the type of the oscillator.
In this article, we shall discuss the concept of oscillators further, show different types of oscillators, and talk about how you can apply them to your FX trading.
Forex Oscillators: A Closer Look
As was mentioned earlier, oscillators are extremely popular among all traders. There are many different categorizations of this type of indicator. But one especially popular type of momentum oscillators, which provide forex traders with information regarding market momentum and where prices might be headed next.
We are going to talk about such types of oscillators and how to use them in the coming sections. But first, what different types of oscillators are there in general?
Well, there are two basic categories of oscillators, banded and centered.
Banded Oscillators
Some of the most useful oscillators fall under the category of banded. Being banded means that the oscillator has essentially two lines or rather two ranges that the price can fluctuate between them. Such types of oscillators are mostly used for identifying overbuying and overselling. As such the lower band or the lower range would normally be between 0 to 20 and the upper band or the upper range would be between 80 to 100.
Centered Oscillators
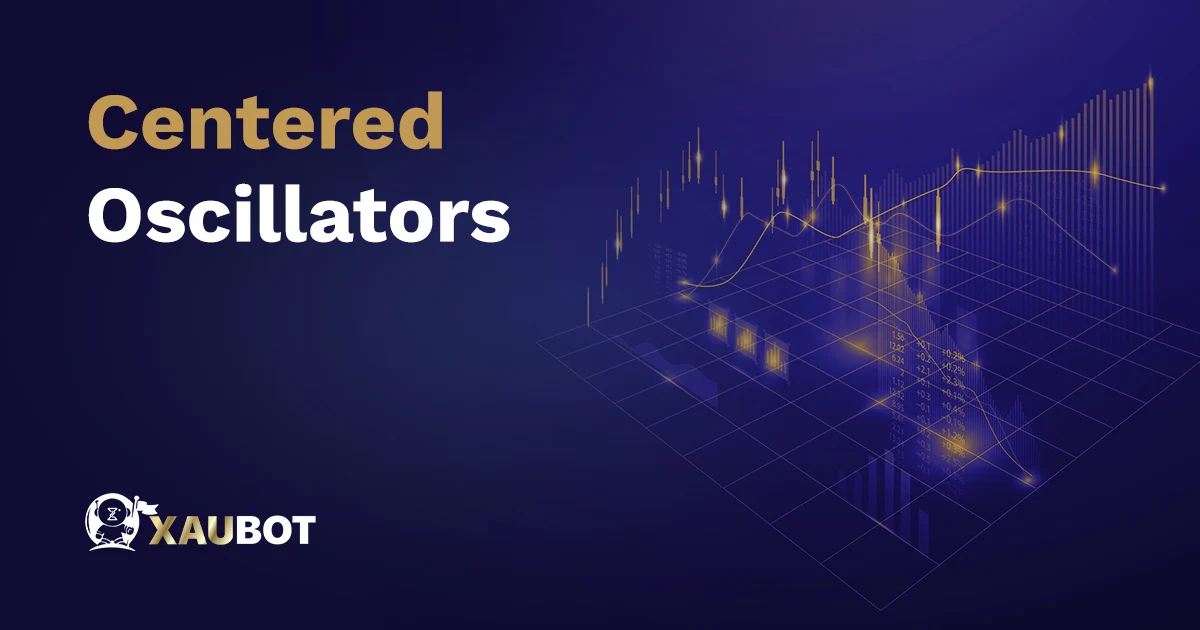
centered oscillators
There are other oscillators which would be regarded as a contrast to banded oscillators. These are centered ones, in which, as the name suggests, there are no two bounds or two ranges. Rather, in centered oscillators there is a centered line or central range. Thus these indicators cannot be used to indicate overbuying and overselling very well. However, they can be used to indicate the general momentum of the market – i.e. if prices move above the centered oscillator line it indicates a bullish movement and vice versa.
Now that we know the general categorizations of oscillators, let’s have some actual examples of these two types.
Banded Oscillators: Relative Strength Index & Stochastic
Let’s begin by categorizing again. Both the relative strength index (RSI) and also the stochastic indicators are banded oscillators of the moment kind – which means they analyze the momentum of the market.
Although they have many similarities, the stochastic and RSI oscillators use different formulations to provide the relevant data.
A stochastic indicator analyzes the market prices as they are currently in comparison with what they were in previous time periods. Thus finally it is able to provide a price momentum to the forex traders. On the other hand, the relative strength index will solely analyze the increases and decreases that occurred lately.
It is mainly advised that relative strength index be used for trending markets and that stochastic oscillators be used when trading in markets with higher volatility. Forex traders can also use them both at the same time in order to obtain more reliable and more precise data regarding the market.
When applying such technical indicators, there are certain points to keep in mind.
First of all, since both the stochastic and RSI oscillators are banded, the upper and lower limits ought to be taken into consideration with a much higher precision. Because should prices break the thresholds on either side, that would be crucial information.
Another crucially important piece of information regarding such indicators has to do with potential reversals in prices.
How could traders pick on reversals with the help of banded oscillators? It can be said that a reversal is imminent if there is a substantial divergence between the prices and the oscillators. This means if prices diverge too much from the oscillator, we might just encounter a reversal in prices. So always make sure to pay attention to when the oscillator is imitating the prices closely and when it is not.
Centered Oscillators: Moving Averages Convergence Divergence
As previously stated, centered oscillators, unlike banded oscillators, do not oscillate between two thresholds, rather move around, above, or below a centered line.
The most popular centered oscillator is the moving averages convergence divergence otherwise known as the MACD.
The way MACD works is through two exponential moving averages. First a slow exponential moving average which has a 26 days as its time period is obtained, then another fast exponential moving average with a time window of 12 days. After that the difference between these two figures is calculated.
MACD can be used to obtain data with regard to both market trend direction and also trend momentum. As such, by assuming the center line as the basis for the MACD, then the position of the MACD compared to this line would provide trend direction and the distance between them would provide the trend momentum.
Furthermore, another exponential moving average with a period of 9 days is also imposed upon the MACD in order to indicate a signal line.
Of course, in terms of trading pairs in the forex market, this signal line can play a role with more immediate implications – i.e. when to buy and when to sell. In this regard, when MACD is lower than where the signal line is, this is indicative of short position or selling. And when the MACD is higher than the signal line, this would indicate a long position or buy.
Similar to the above-mentioned banded oscillators, the centered oscillators can also be used to obtain information regarding a possible upcoming price reversal.
As such, similar to banded oscillators, divergences in centered oscillators can indicate a potential reversal. So make sure to pay attention to any divergence between the MACD and price action graph. In making sure that what you have obtained from these indicators is accurate and precise, sometimes it might be necessary to confirm your obtained data by using other technical indicators. This is why it is ordinarily recommended to use more than just a limited number of technical indicators.
Using Technical Indicators Together
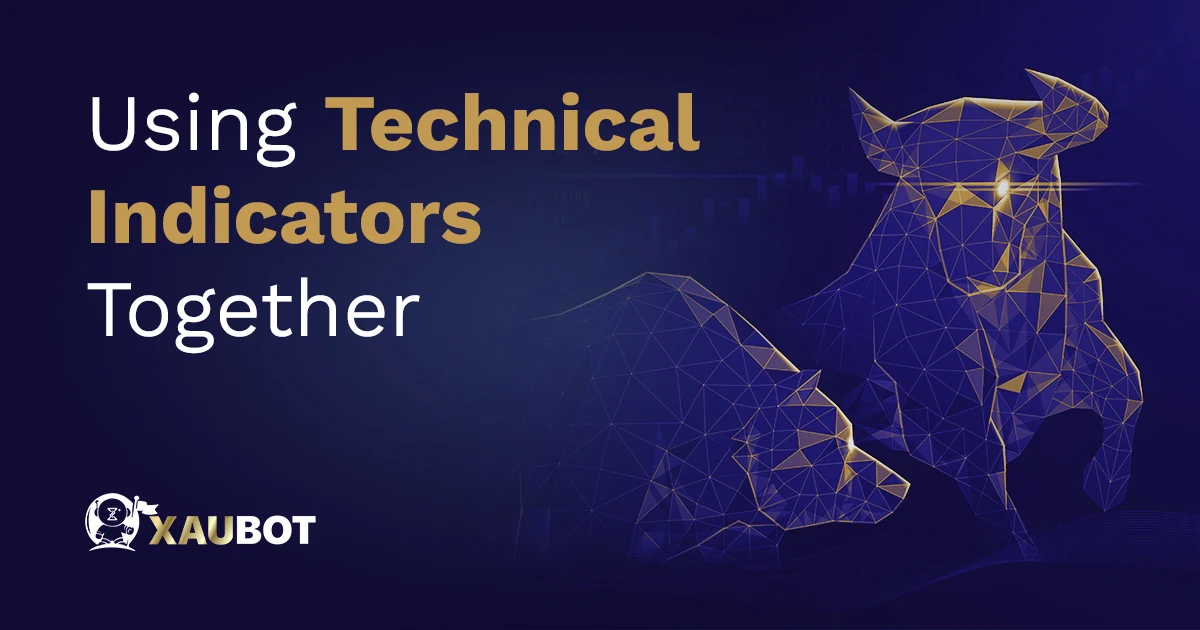
using technical indicator together
Confirmation is always necessary before taking action. So when you get any piece of information, sit on it first and obtain further confirmation. For example, if a centered oscillator signals a price reversal, it might be a good idea to get help from a banded oscillator to also check on overbuying and overselling status of the trading pair.
This is very important because even the best technical indicator might sometimes provide you with less than accurate data.
Conclusion
Oscillators are among the most important technical indicators for any financial market trading, especially for trading in FX markets. They can provide valuable information regarding trend momentum, trend strength, trend reversal, overbuying, overselling, among others.
Oscillators can be divided into two groups of banded and centered oscillators. Banded oscillators will move between two ranges of upper and lower. While centered oscillators move relative to a center line.
Among the most popular oscillators are the stochastic oscillator, relative strength index, and the moving averages convergence divergence.
For more forex article , follow XAUBOT.

