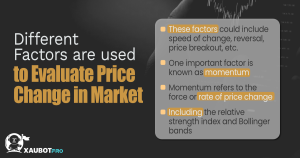
When you want to gauge the changes that occur in prices, there are different kinds of factors to consider of Bollinger Band. Some try to look at the speed of the change, while others might attempt to measure the potential for reversal and price breakouts. But one of the best factors to consider is actually momentum.

The notion of momentum will consider the force and power, in other words, the rate with which prices might be changing within any given market, in this case being the foreign exchange market.
As such we have momentum indicators, such as the relative strength index or RSI and also the Bollinger bands. In this article we are going to discuss these two and go through the alarms that you can set for them in XauBot Pro.
Take a look: XauBot AI Pro the Perfect Blend of Fundamental and Technical Analysis
The Role of Momentum Indicators in the Forex Market
As we discussed briefly in the intro, one of the general approaches to market analysis in any market, is to analyze the changes that occur in prices. Now what is important here is in what way exactly this analysis of price change takes place. There are many different approaches that are used in order to analyze price change.
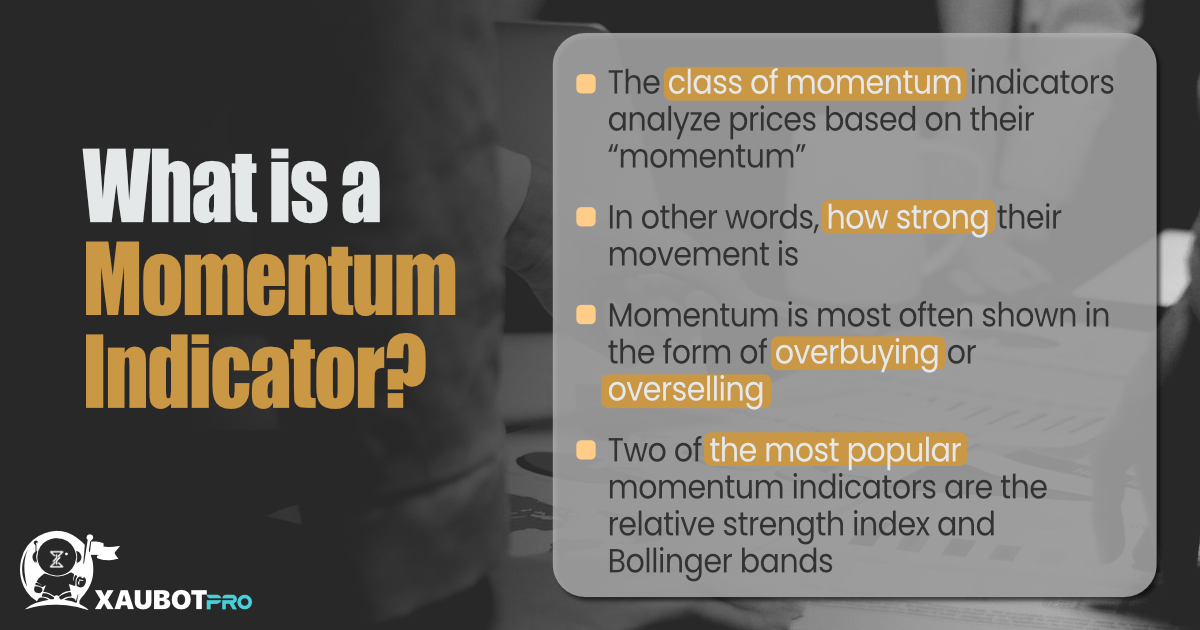
Here we want to discuss the role of momentum in the domain of price analysis. And what is momentum exactly? Momentum is the force or rate of price change. In other words, momentum can define how strong the movement of price is and how dependable it can be.
But let’s be more precise. How exactly is this strength of price movement shown through momentum? Most often, momentum works by identifying the areas in the market where we see heavy overbuying or overselling to the same degree of strength or varying degrees as well.
This is clearly an indication of the force behind price movements in the market. This force is symbolized in this way by the amount of trading volume and amount of positions that traders assume with respect to a certain asset or a certain position itself. This is how with the help of momentum indicators you can find out whether a position is oversold or overbought.
And also most often, momentum indicators are actually oscillators. As the name suggests, an oscillator is when an indicator will bounce back and forth between two extremes and at any point its whereabouts with respect to those two extremes is the value that it represents. Momentum indicators and oscillators are extremely important in the forex market. But perhaps among them, the relative strength index and Bollinger bands are more significant.
Take a look: Limiting Drawdowns, Maximizing Profits, XauBot’s Money Management and automated trading Techniques
Using RSI and Bollinger Bands to Analyze Prices in Forex
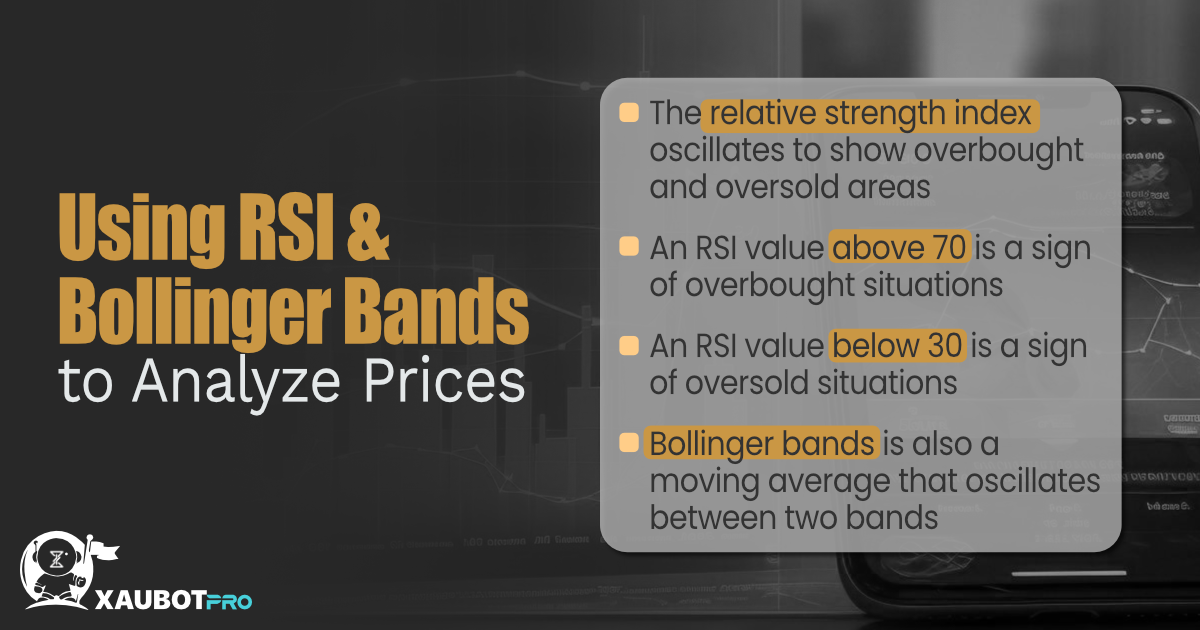
The relative strength index or RSI being an oscillator moves between two extremes. These two extremes are already defined for it as the number 0 and 100. By moving between these two, this indicator will show a value at any given point. And that value is taken to interpret what the relative strength index means with respect to the market.
And the way it is interpreted is through the precise value that the RSI shows. For instance any value for RSI that is above 70 is indicative of overbought areas in the market and at the same time any value for RSI that is below 30 is indicative of oversold areas in the market.
And also the way you use this information is by taking what it means and basing your decision on that given point in the market. In other words, when the market is overbought it means too many traders are buying the position and so chances are the long positions are too saturated. Thus it means there are high potential for a reversal in prices toward bearish conditions.
The other way around is just as true. If the market is oversold, it means there are too many short positions in the market and that the market is prime for a bullish reversal.
On the other hand, Bollinger bands are also composed of three bands. The middle band being the moving average that is defined and interpreted with respect to the position of the two other bands.
The tighter the three bands, the less volatility in the market, and the more spread apart and wider, then it means there is more volatility and ergo chance for a heavy movement in the market.
In any case, both of these indicators can be used to gauge momentum with respect to market prices.
Take a look: Money Management with XauBot AI Pro Advanced Strategies Revealed
Setting Alarms for RSI and Bollinger Bands in XauBot Pro
After having grasped a full understanding of both the relative strength index and the Bollinger bands, it is time to discuss the relevant features in XauBot Pro for these two.
There is a parameter with the help of which you can set alarms for these two indicators, in that you can define your own threshold for them. Thus, if and when these two indicators reach a certain level or threshold, then the expert advisor XauBot Pro will send you alerts to notify you of the opportune moment.
In this way, you will be able to make a move at the exact right time and never worry about the chance being wasted.
Take a look: Role of Money Flow Limits in Market Analysis in XAUBOT Pro
Conclusion
In this article we talked about the role of momentum in price analysis, especially in the forex market. We also looked at the notion of momentum indicators, with special attention to oscillators such as the relative strength index and the indicator Bollinger bands. Finally, we discussed the feature in XauBot Pro that allows you to set limits for them in order to receive timely alarms for when those limits are reached.

