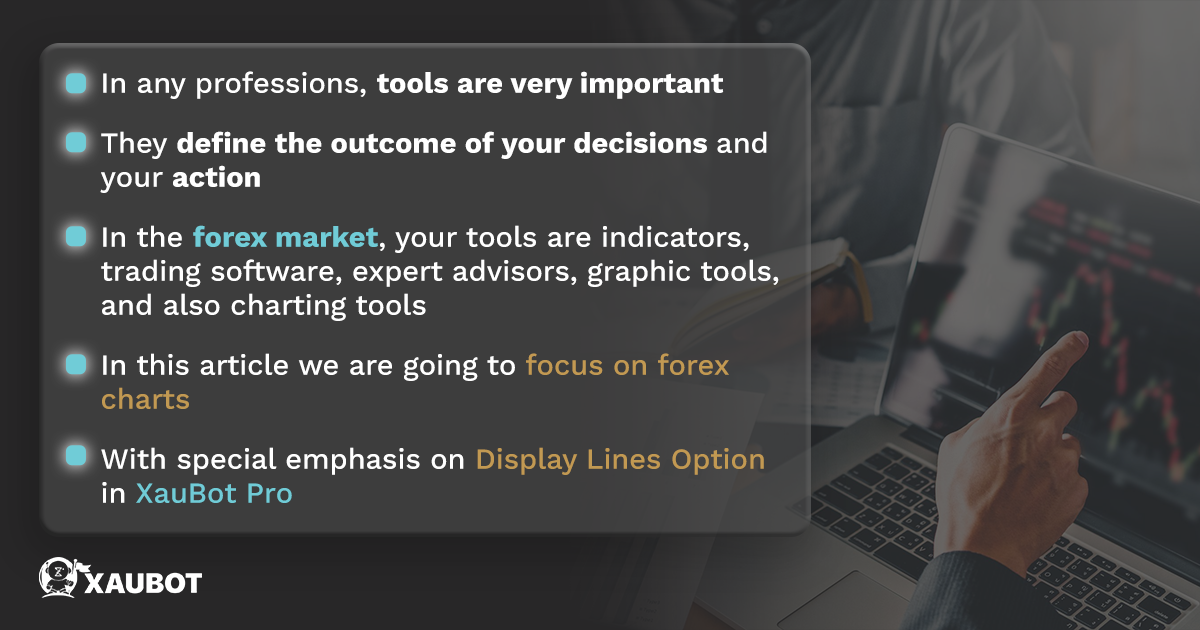
In any profession, the tools that you have for Chart Analysis at your disposal will ultimately define the success or failure that you can attain in that domain. The story is the same in the case of the foreign exchange market and with trading.

There are certain tools that you have available or you can make available that will define the outcome of your choices and operations in the forex market. These tools include the technical indicators that you have available, the expert advisors, the graphic and drawing tools, and of course the charts themselves.
In this article we are going to take a closer look at the charts that you can use in the forex market and the charting tools that are available for them. We are also going to discuss the tools and parameters integrated into XauBot Pro for charting, in particular the parameter called the Display Lines Option and how it can help you.
Take a look: Filtering Out Noise How XAUBOT’s Advanced News Filter by trading tools
A Comprehensive Look at Notion of Chart Analysis in Forex Market
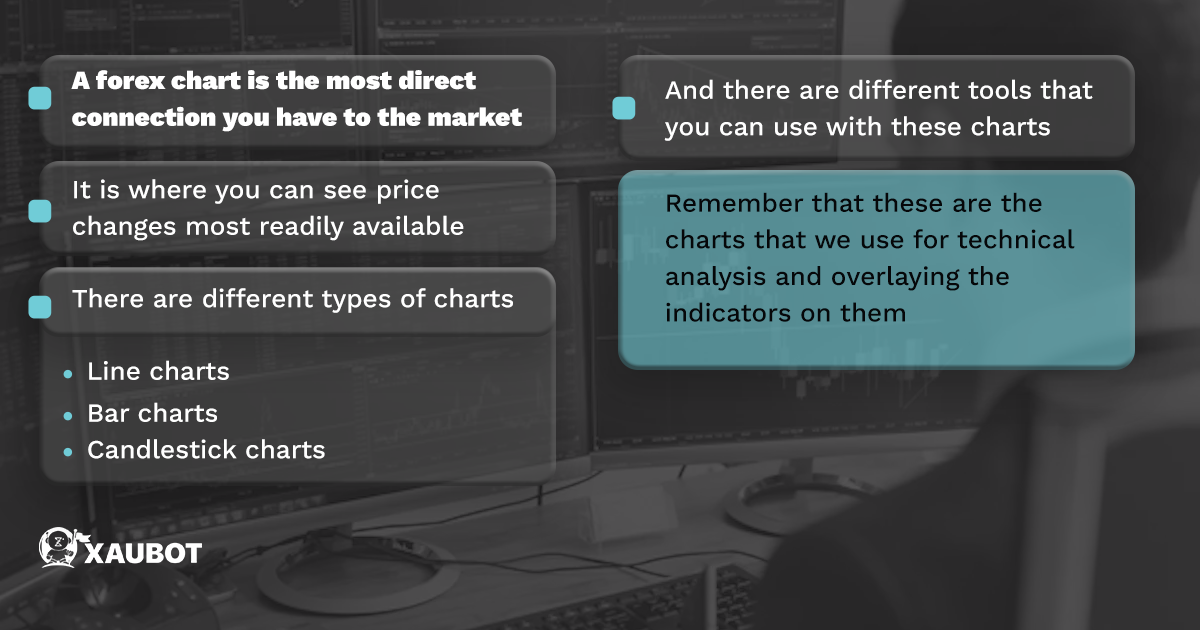
Forex charts are the most direct access that you have to the market. They are the visual representation of everything that is going on in the market at any given moment. So whatever happens in the market with respect to price changes you can directly see on the charts right there.
A trading chart is where you derive your information for analysis and thus making decisions with respect to opening new positions and making new moves.
There are different types of charts available with many different options and numerous tools integrated into them. But as a whole there are three main types of charts, namely line charts, bar charts, and candlestick charts, which we will discuss briefly as follows:
- Line charts: a line chart is what it says, a line that represents the price changes in the market over time. So as the definition is simple so is the function of the chart itself, meaning that it is very easy to understand and to comprehend. In fact that is the biggest advantage of line charts in the forex market, which means the fact that they can be read and understood easily and quickly. As a result, line charts are mostly associated with moving averages. Since the line lacks complexity and too much detail, it is perfect for showing averages of prices rather than too much detail associated with their movement and their changes. Of course this simplicity is both an advantage and a disadvantage. While it is easy to read and good for showing simple and averaged out data, any given line chart also lacks the necessary detail for showing complexity and nuanced changes in prices.
- Bar charts: these type of charts are the most used and widely applied charts across all financial markets including the forex market. It is also interesting to note that bar charts are used more than any other chart type with respect to technical analysis and applying technical indicators to them. The reason is related to their added complexity and nuanced detail compared with line charts, where we only have a line for simple representation of data. A bar chart is made up of bars, as the type clearly states, and each bar has the capacity to represent price changes over a day in addition to high and lows and any changes that occur in prices no matter how small or otherwise.
- Candlestick charts: the third and last category of chart types that we are going to discuss are known as candlestick charts. As the name clearly signifies, this type of chart consists of candlesticks. This means the visual representation of price and market information is carried out with the help of candles. There are certain similarities between these chart types and also the bar charts that we discussed above, but there are more nuances in the case of candlestick charts. A candlestick is symbolic of the price change recorded during a day and it is able to show the amount of change in price that has taken place in addition to the highest and lowest prices registered during that day. In addition, the mere method by which a candlestick records prices can tell us whether they are being pushed higher or lower.
What you need to know about each chart type is that various kinds of tools are used with them and that is how each one is able to present us with an array of indicators and analysis tools.
And this is exactly where the huge and significant importance of charting can be found. It is the charts that we use in order to overlay that analysis methods associated with technical methods and also indicators. Now let’s take a look at some of the charting capabilities of XauBot Pro.
Take a look: Holiday Season Trading Made Easy XAUBOT’s Holiday Filter Explained
XauBot Pro’s Charting Tools and Display Lines Option
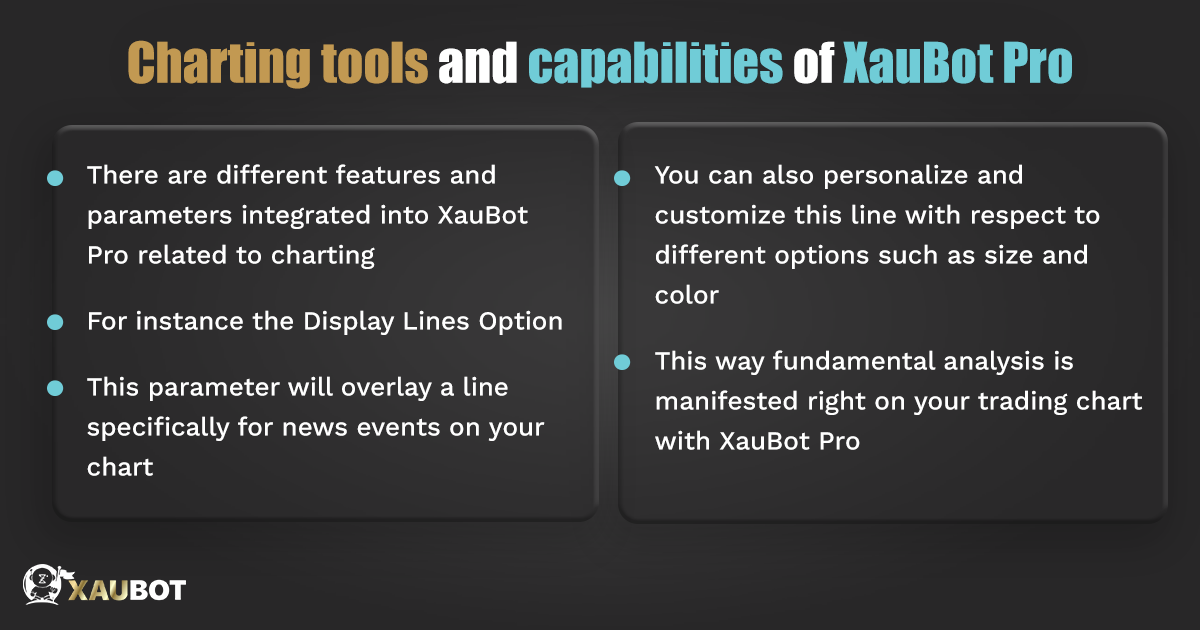
XauBot Pro comes fully equipped with countless different parameters in order to bring the ultimate automated trading experiences to users. One aspect of such parameters is related to charts and charting tools in general.
One particular parameter related to charts is known as the display lines option. What is interesting about this parameter is that with the help of it you can overlay nes lines right on your trading chart.
In this way not only do you get data pertaining to technical analysis from your charts, you will also be able to obtain info regarding fundamental analysis as part of the news lines that are also shown on your chart. But you can do more. Not only is there an option to display such lines on the chart, there is also another option that lets you make changes in these lines the way you want them, including changing colors and size.
Take a look: How to Become a Disciplined Trader
Conclusion
A trading chart is the closest interaction you have with the market and the price movements that are registered and shown to users. There are different types of charts used in the foreign exchange market, including line, bar, and candlestick charts. In this article we focused on these different forms of charting techniques in forex and also discussed the parameter known as display lines option in the XauBot Pro expert advisor or EA.

