
Candlesticks provide you with a really customizable way to create charts in the forex market. These charts make the data more understandable and the patterns that exist in them can provide additional valuable data with regard to overall trends in the market and even market sentiment.

Among the patterns that exist on candlestick charts are dual candlestick patterns, also referred to as double candlestick patterns. As the name suggests, two candles are responsible for the formation of such patterns. Even though they are not very difficult to detect and understand, it is highly important to familiarize yourself with the different types of dual candlestick patterns.
A Closer Look at Dual Candlestick Patterns
Unlike single candlesticks, which stand alone and are interpreted as such, dual candlestick patterns rely on each other. This means there is a significant relationship between the first and second candle.
In technical terms, in a dual candlestick pattern, the first candle is referred to as a signal candle. The signal candle is largely responsible for providing data about the trajectory of the trend. And the second candle is known as the confirmation candle. Of course as the name suggests, it mainly acts as confirmation for the information provided by the first candle.
In the following sections we are going to discuss various types of dual candlestick patterns. Some are bullish and some are bearish. Please also note that they are presented in no particular order.
Bullish Engulfing Pattern
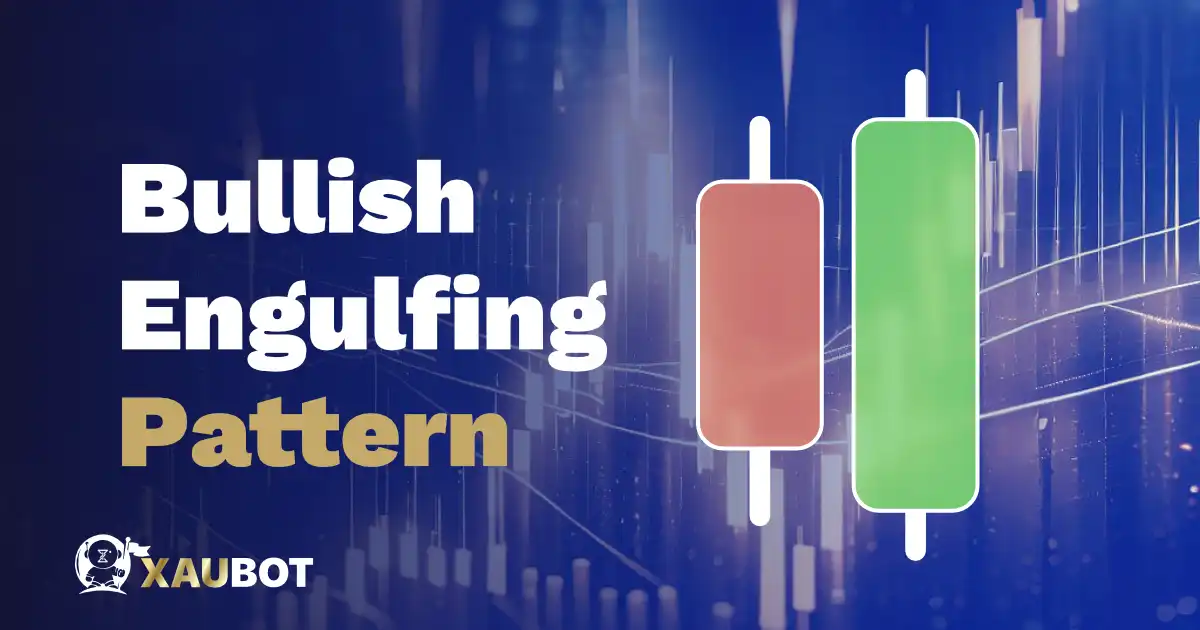
Bullish Engulfing Pattern
This pattern signifies the beginning of a bullish trend. The first candle in this double combination is a bearish candle, which means the color of the candle’s body would be red. The second candle however will be a green bodied candle which is also bigger than the first candle from both top and bottom, hence engulfing the first one. Being a bullish reversal pattern, this type of engulfing pattern is seen at the bottom of a downtrend.
Bearish Engulfing Pattern
Of course the opposite candlestick pattern from the one mentioned above is the bearish engulfing pattern. In this combo, the first candle is a bullish candle, which means it has a green body. This means the opening price was higher than the closing price. The second candle, on the other hand, is a bearish candle and red, meaning that the closing price is much lower than the opening price.
Being a bearish reversal, this pattern is seen at the end of an uptrend. So when an uptrend reaches its apex, it is possible to see this pattern.
Tweezer Top

Tweezer Top
The tweezer top is yet another bearish reversal pattern. As a result, it is normally seen when there is already an uptrend in the market. Tweezer top is made from two candlesticks that have the same height from the top. The first one is green and the second one is red. They might also have an upper wick, even with the same height as well.
This relationship between them signifies that there was an attempt by the bulls in the market to push prices further, but it was not enough. The tweezer top can form the new resistance level, after which a downtrend might ensue.
Tweezer Bottom
A tweezer bottom on the other hand is a bullish reversal pattern. Therefore, it is normally seen on the lower part of a chart where there is already a downtrend well on its way. Unlike a tweezer top pattern, the tweezer bottom is made from two candles that have the same height from the bottom. The first one is red and the second one is green. They might also have a lower wick or shadow with the same height.
A tweezer bottom indicates traders were pushing to sell, but bears couldn’t push further. The tweezer bottom can register a new supper level followed by an uptrend.
Dark Cloud Cover
This candlestick pattern is a bearish signal. As a result, we would normally see this when there is an uptrend. Even if there is a sideways trend, a dark cloud cover provides a chance to sell before prices fall lower.
This pattern has a long green candle as the first one. The second candle, stands higher than the first and is a bearish or red candle. So the bottom of the second candle reaches the middle of the first, and of course its top is much higher.
Bullish Harami Line
The bullish Harami line is of course a bullish reversal pattern. Although it is not the most powerful bullish reversal and required additional confirmation. The pattern consists of a very small bullish candle which is then followed by a really long bearish candle. The red candle completely hovers over the small green one. This pattern should be seen at the bottom of a downtrend.
Bearish Harami Line
The bearish Harami line is of course the exact opposite of the one mentioned before. It is seen when there is an uptrend in the market. It consists of a really long bullish or green candle, followed by a really small bearish or red candle. The difference in size is quite important in the Harami line. But keep in mind that this bearish reversal is not so powerful and usually would require further confirmation.
Matching Low Pattern
The matching low pattern is made from two candlesticks that are both bearish, i.e. red. This candlestick pattern is of course seen when there is already a downtrend well on its way in the market.
The way it is formed is when a long bearish candle is followed by another bearish candle. The key feature is that the closing price of both of them are the same, so they match each other on the bottom. This way they can also form the new support level together.
Piercing Line Pattern
This candlestick pattern is a bullish reversal, so it has to be detected at the bottom of a downtrend. Please keep in mind that the place of formation and detection is extremely important for a candlestick pattern. If it is not spotted in the right place on the chart, then it is not what you think.
As far the piercing line pattern is concerned, it first registers a bearish candle. But the second candle is the important one. The second candle is bullish. It starts even lower than the low of the previous candle. But the closing price of the second candle is higher than its opening – this making it green – and it finishes around the middle of the first candlestick.
Conclusion
Dual candlestick patterns are important patterns on a candlestick chart that are of course made as a result of combining two candles. These two candles have a significant relationship with each other and are interpreted together. In this article we presented you with an extensive list of dual candlestick patterns.

