When it comes to being involved in financial markets, your connection to the market is all that matters, XAUBOT Pro. In other words how you establish your connection to the market itself. The window that lets you see through the numbers and figures and be able to interact with the market in reality.

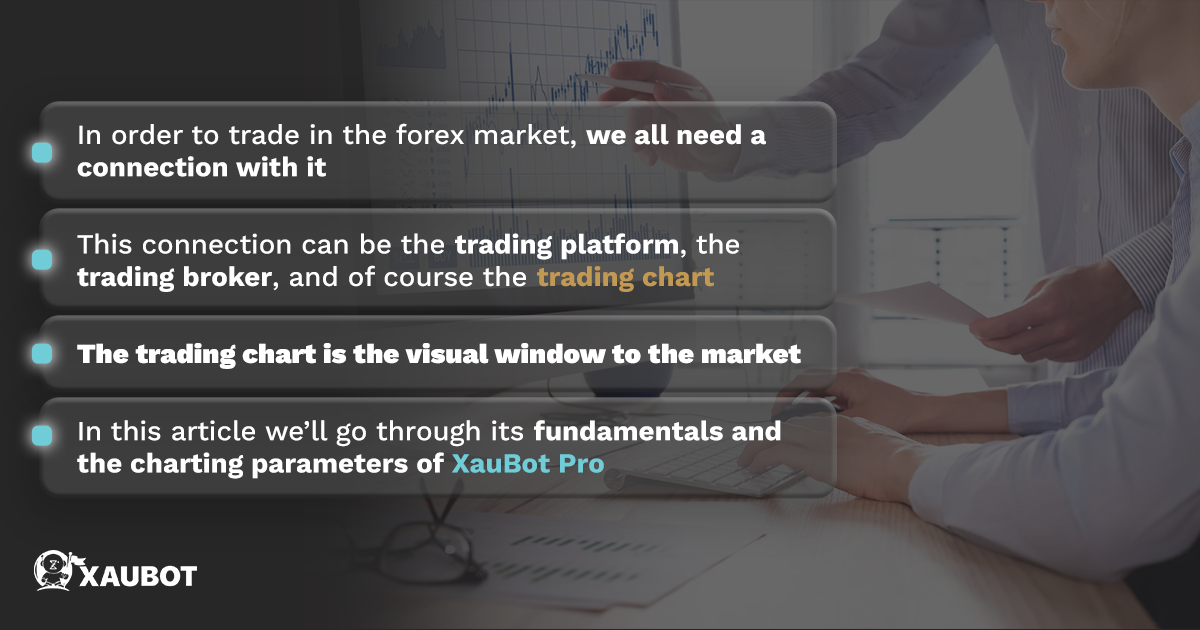
In the forex market, there are so many different connections that actually let you interact with the market, including the trading platform that you are using such as MetaTrader 4 and the broker whose service you employ, among others.
But there is another window – a visual window – that allows you to peek through the market. We are of course talking about trading charts.
In this article we are going to go through the fundamentals of charting in the forex market and see how XauBot Pro can help you in this regard.
Take a look at: Money Management with XauBot AI Pro Advanced Strategies Revealed
Fundamentals of Charting in the Foreign Exchange Markets
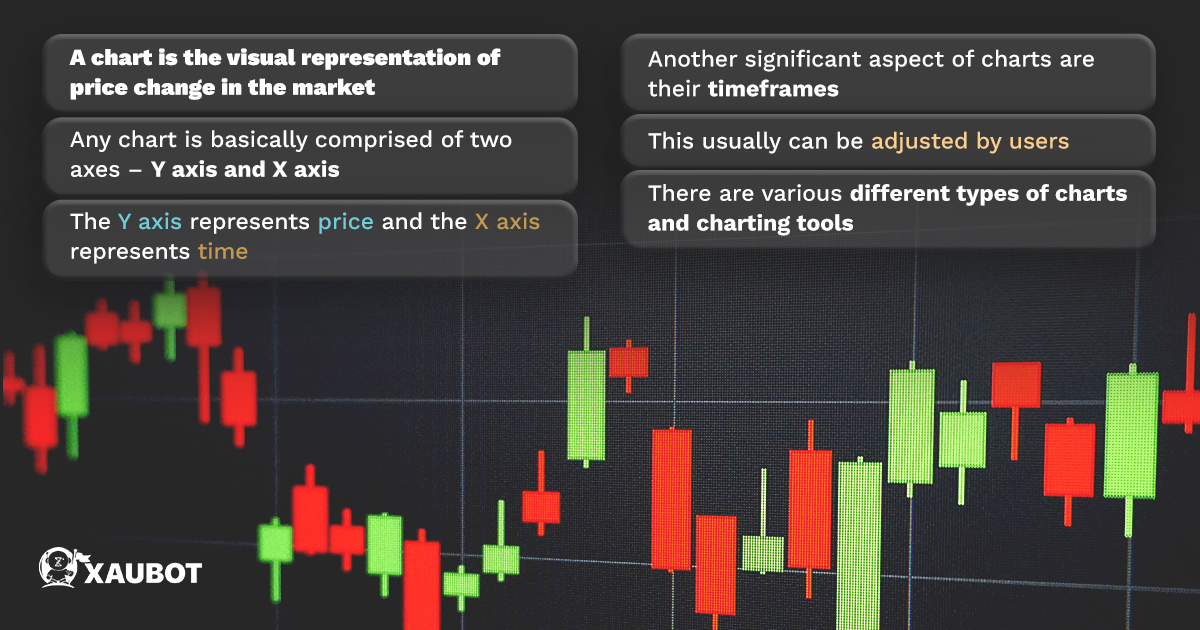
As we discussed briefly above, a chart can be considered as a visual or graphic window that lets you quite literally see the market as it unfolds in every moment. In other words we can also say that a chart is the visual representation of price change in the market. As prices keep changing in the market, they are registered and recorded right on the trading chart for the trader to see.
So let’s take a brief look at the composition of charts as a whole in financial markets and how they help us in their interpretation. Any chart is basically composed of two axes, naturally one being the Y axis and the other being the X axis.
In this composition, the Y axis is used to represent the price and the changes that would occur in them, and the X axis is used to indicate the time and the passage thereof. Put together, they simply create a way for us to see how prices change as time goes on.
Another significant aspect of charts are their timeframes. This means charts do not all have the same time frame. This is something that can be adjusted by the traders themselves. Given the scope of trading and the trading strategy being employed, you can adjust the timeframe of the chart widely, from seeing hourly timeframes all the way to monthly and even annually.
Furthermore, there are different types of charts for different purposes. For instance there are line charts which provide us with an easy way to represent averaged out data. Then there are bar charts which provide more detail and nuance for exhibiting price change. And of course we also have candlestick charts, which give us an easy way to understand price change on a day to day basis.
Take a look at: Limiting Drawdowns, Maximizing Profits, XauBot’s Money Management and automated trading Techniques
The Significance of Charts in Forex Trading
There might be some tools or features that we employ in the market that could go overlooked. A chart is definitely one of them. We do so much of the entire trading process solely with the help of a chart that would be otherwise impossible to carry out.
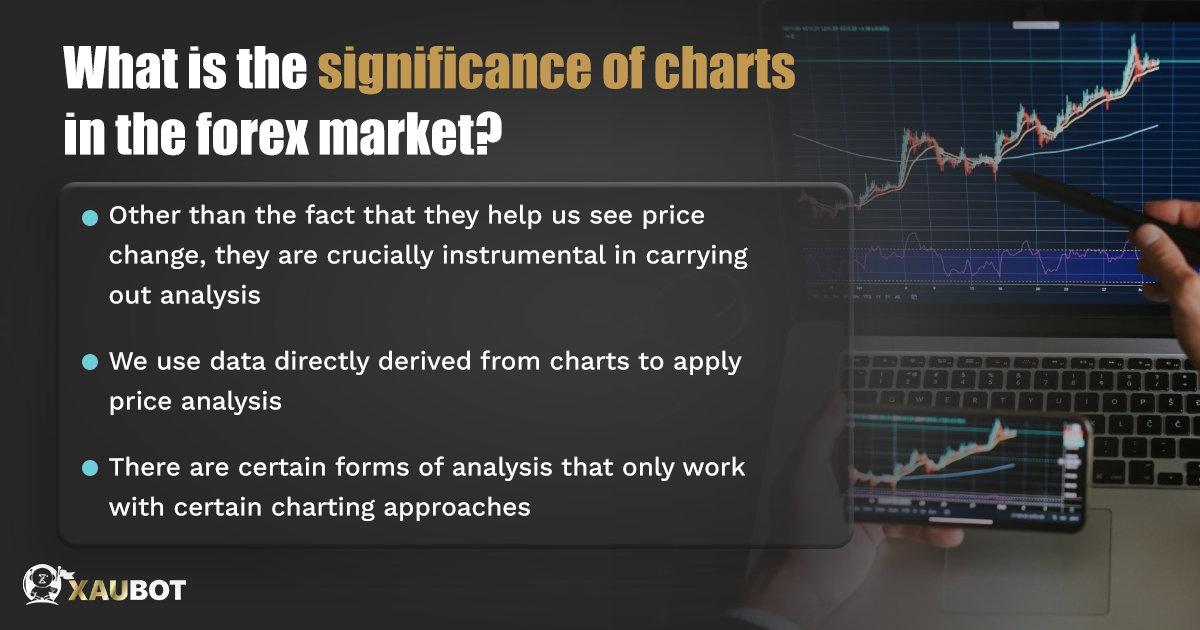
So other than the face value of a chart, which allows us to see the price changes that occur in the market at any given moment, charts are crucially instrumental in our ability to carry out market analysis in various forms and different degrees.
When it comes to price analysis and technical analysis, we apply these trading analysis methods directly on the chart and the data taken from it. Therefore the data for price and market analysis comes directly from a chart.
Now when we have different forms and methods of analysis, this means we will require different types of charts for them. For instance in the case of certain indicators such as moving averages and momentum indicators, line charts are the best tool for the representation of the analysis.
On the other hand, we can get help from bar charts and candlestick charts to obtain valuable and important patterns on the chart that can repeat themselves. For instance we have a huge category of price patterns in the category of candlestick analysis and candlestick patterns. To carry out these analyses, we will of course require the presence of a candlestick chart.
So you can just see how important the presence of a chart is in the process of trading in the forex market and of course all the other financial markets in which trading is carried out.
Take a look at: Limiting Drawdowns, Maximizing Profits, XauBot’s Money Management and automated trading Techniques
How Can XauBot Pro Help You with Trading Charts?
XauBot Pro is equipped with so many useful and helpful parameters and features in order to facilitate a truly automated experience of trading in the forex market. There are countless parameters that are related to risk management, safety, profitability, technical analysis, fundamental analysis, and also certain charting tools.
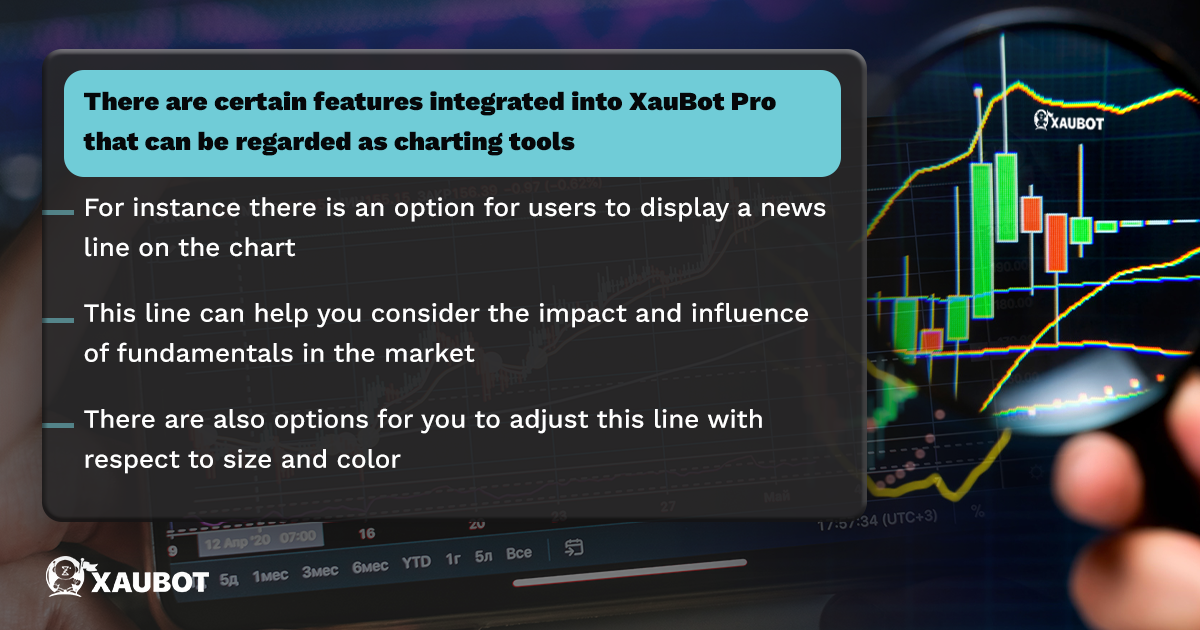
One particular parameter pertaining to charting is known as the display line for the news. As the name suggests with the help of this feature you can transpose an extra line on the chart for news. This way you can track fundamental analysis and the news events that pertain to the forex market on the chart easily and quickly.
This goes a long way toward a truly enhanced and improved chart interpretation in the forex market.
Take a look at: XauBot AI Pro the Perfect Blend of Fundamental and Technical Analysis
Conclusion
Charts are the visual windows that connect us to the market and allow us to obtain and interpret information which we call market analysis and price analysis. In this article we discussed the role of chart and charting tools in the forex market and also saw how XauBot Pro can help you achieve an enhanced experience of chart interpretation with its display news line parameter.

