
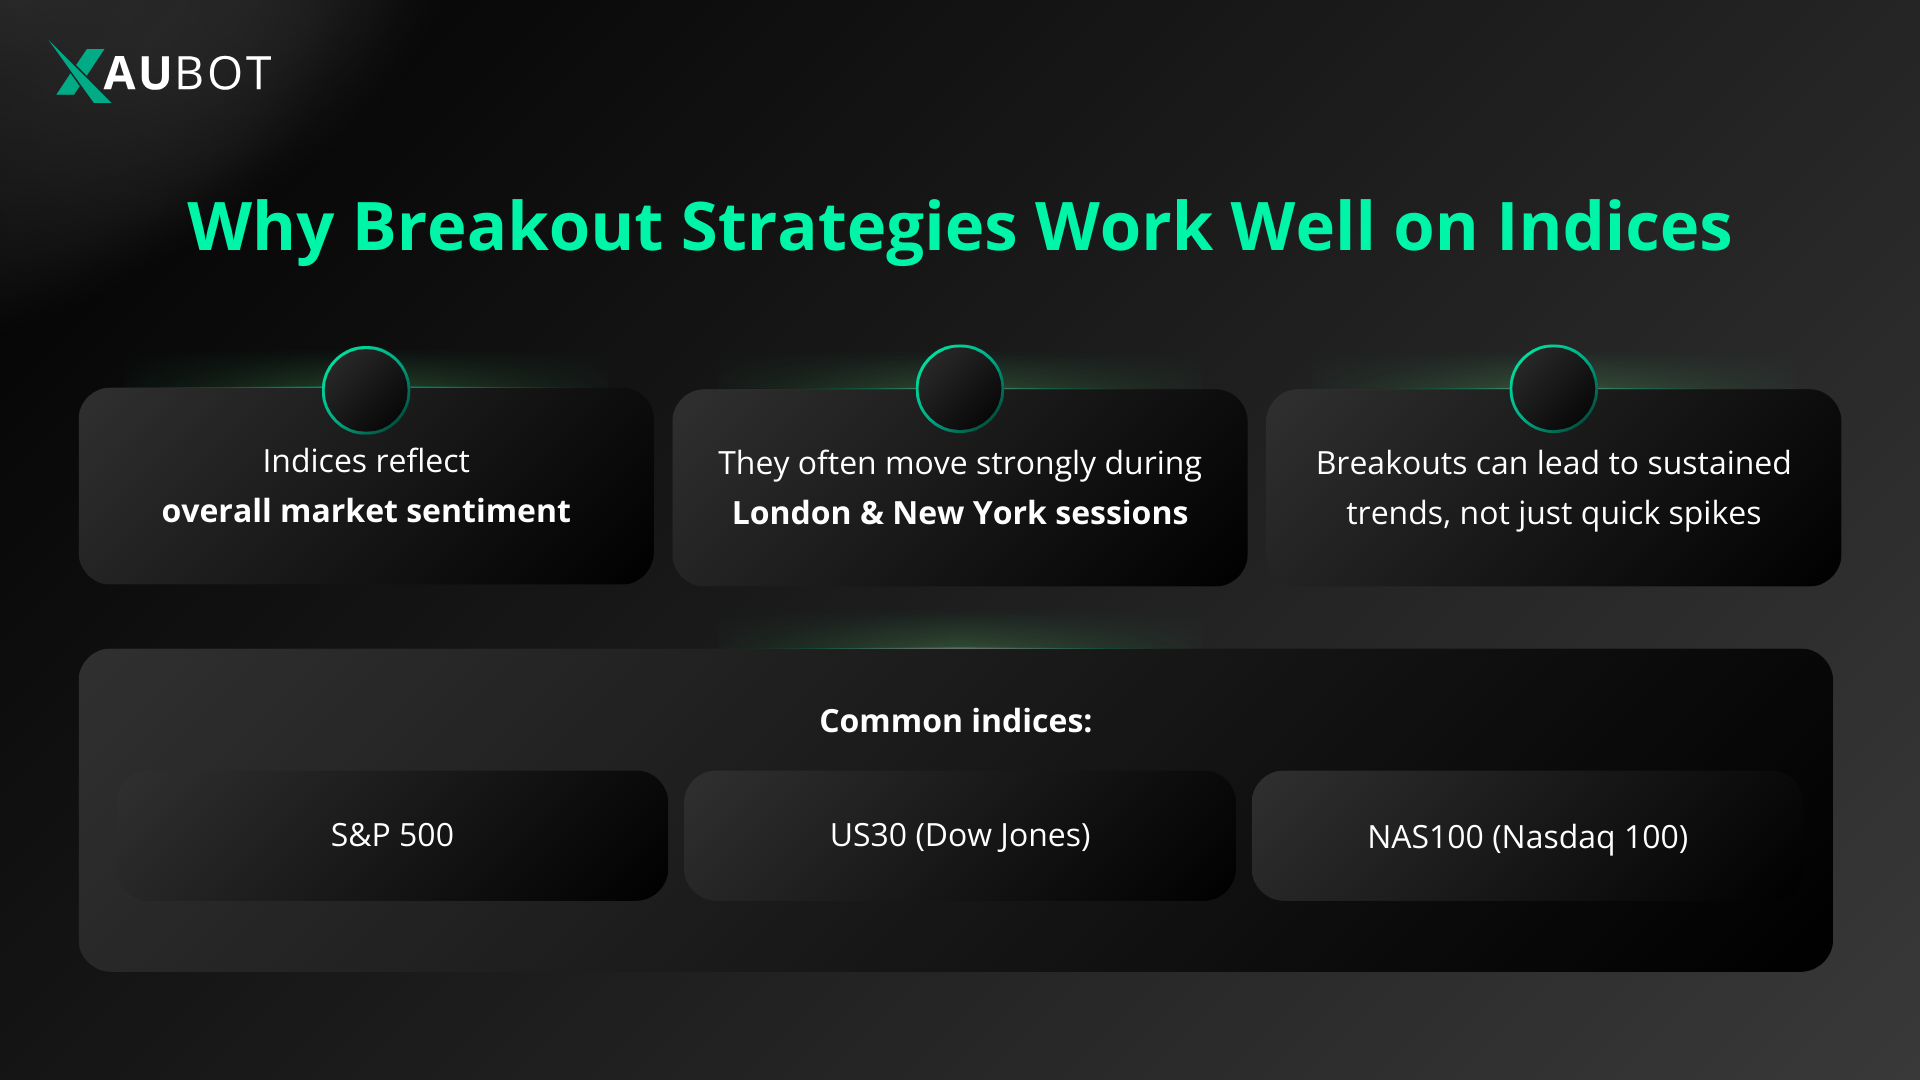
Trading indices with a breakout strategy is one of the most popular approaches among active traders. Indices like the S&P 500, US30 (Dow Jones), NAS100 (Nasdaq 100), and others often consolidate in ranges before making strong directional moves. A breakout occurs when price decisively moves beyond a defined support or resistance level, often accompanied by increased volume and volatility. This signals the potential start of a new trend, allowing traders to capture significant price swings.
Breakout trading works particularly well on indices because these instruments reflect broad market sentiment and tend to experience momentum-driven moves during key sessions, such as the New York open.
What Is a Breakout Strategy?
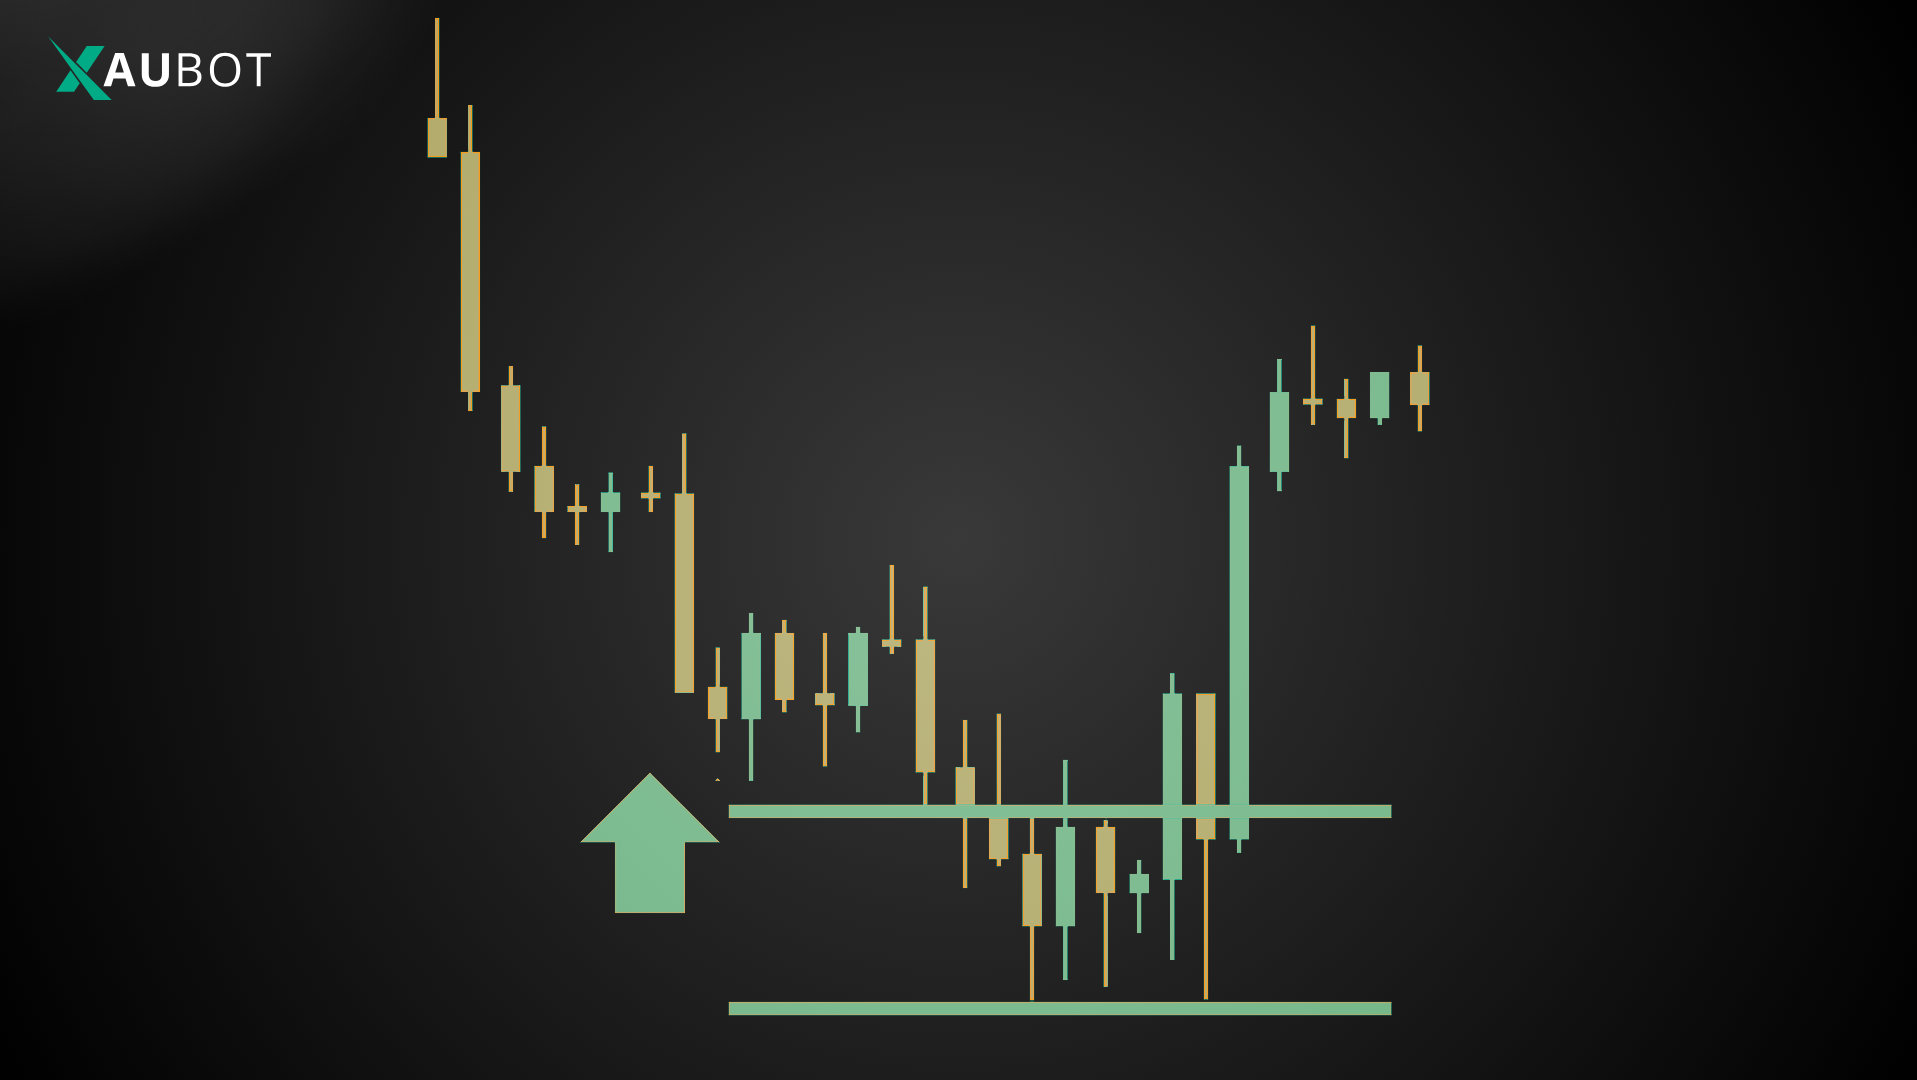
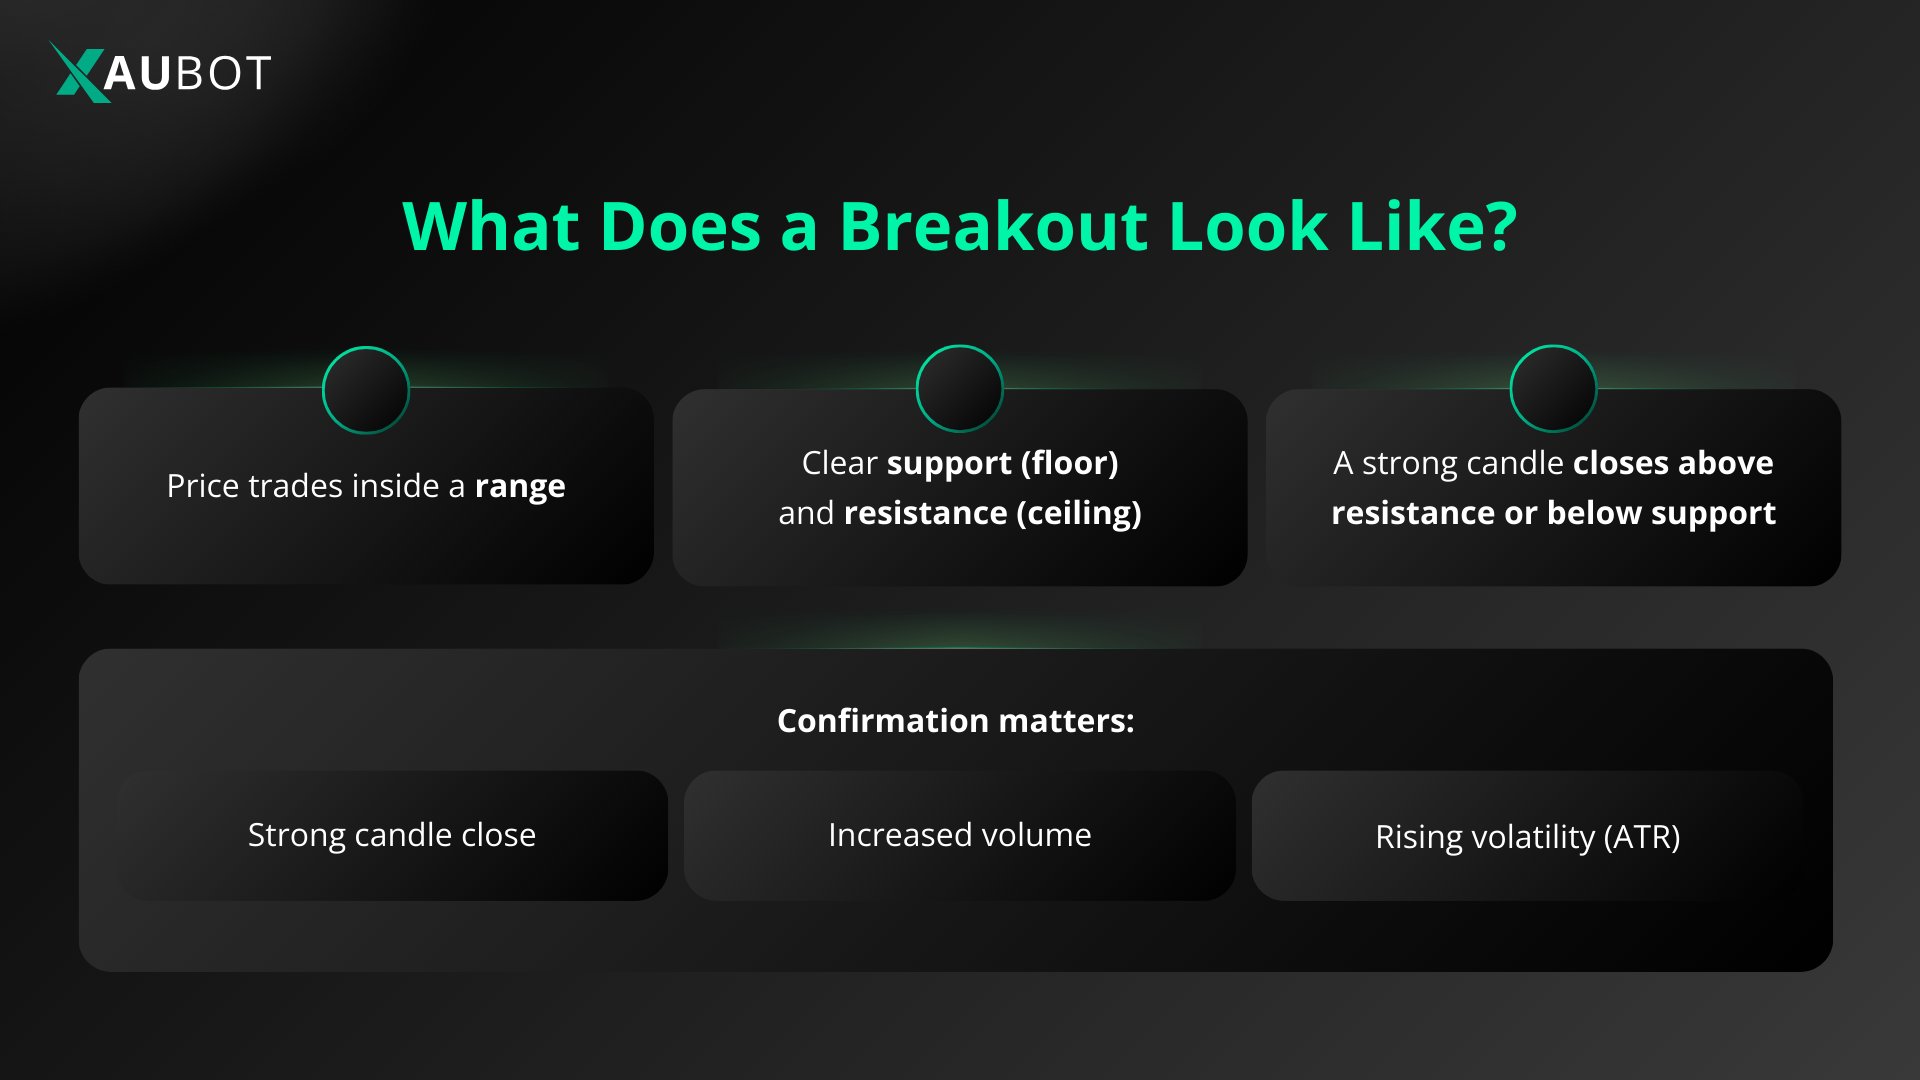
A breakout strategy focuses on those exciting moments when price finally pushes through a level it has been respecting for some time. Picture the price bouncing back and forth between a clear lower boundary (support) and an upper boundary (resistance). Traders keep an eye on these zones because when the price closes firmly above resistance or below support, it often signals that a stronger move is starting.
In everyday terms, a breakout is simply the price escaping its recent trading range. This can happen through horizontal levels based on previous highs or lows, along trendlines, or out of patterns such as triangles and channels. Once the break occurs, traders enter positions expecting the price to continue in that new direction, riding the fresh momentum.
Indices respond particularly well to breakouts because they represent broad market sentiment across many stocks. When confidence shifts, these instruments can produce sustained trends rather than quick reversals. Breakouts usually follow calm periods of low volatility, and the sudden surge in activity helps propel the price further.
The difference between a genuine breakout and a false one often comes down to confirmation. Look for increased volume and decisive candles to show real commitment from the market. Many traders wait for a full candle close beyond the level or even a small retest afterward to improve their entry. With clear rules and patience, breakout trading lets you catch the early stages of meaningful trends while managing the inevitable failures along the way.
Identifying Breakout Setups on Indices
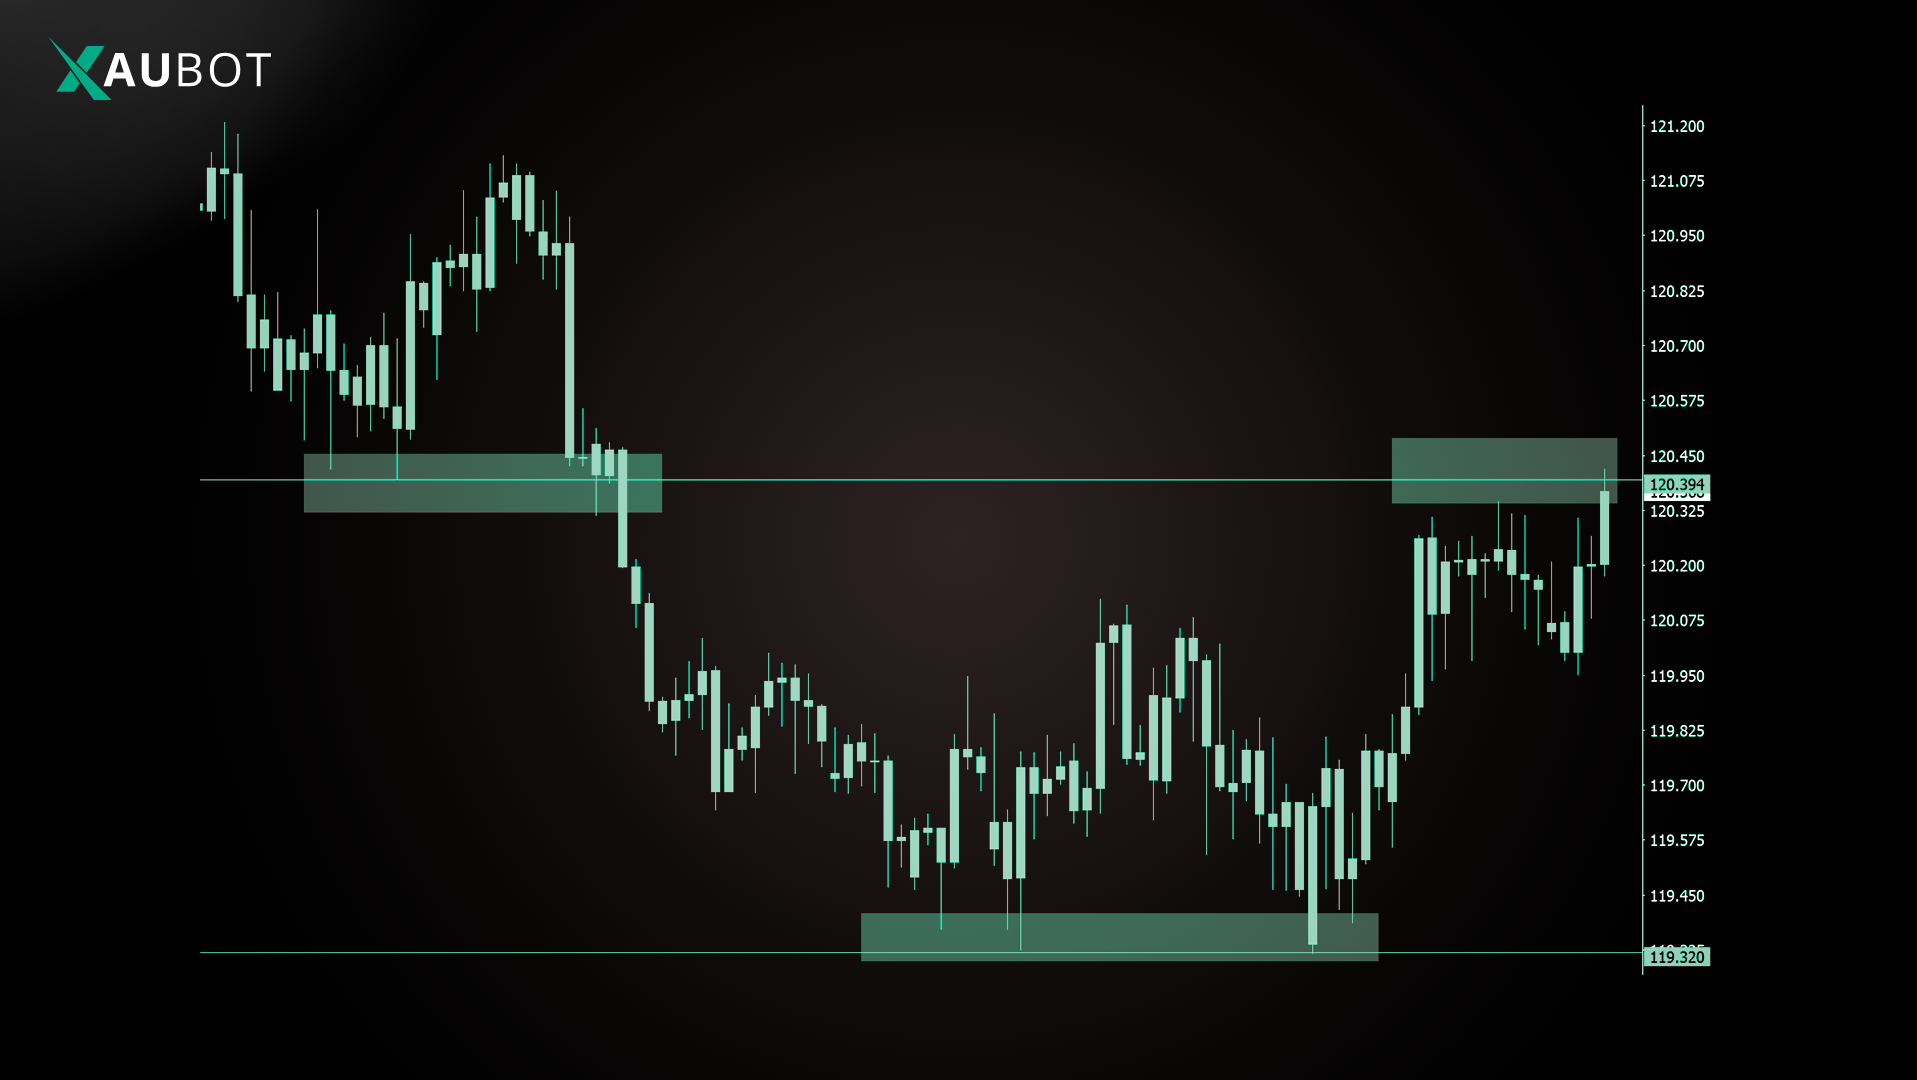
Look for consolidation zones where price trades sideways between clear support and resistance. Common setups include horizontal ranges where price bounces between fixed levels, chart patterns such as flags, pennants, or triangles, and opening range breakouts that prove especially effective around the London or New York session opens.
Multi-timeframe analysis helps. Use higher timeframes (H4 or daily) to identify the overall trend and key levels, then switch to lower timeframes (M15 or M30) for precise entries.
A powerful confirmation tool is the Average True Range (ATR). The strategy often shines when price breaks out with expanding ATR, indicating rising volatility.
Step-by-Step: How to Trade Indices Breakouts
- Identify Key Levels Draw support and resistance on your chart. For indices, focus on recent swing highs or lows, round numbers, or previous session highs or lows.
- Wait for Consolidation Price should tighten into a range. Tools like Bollinger Bands can highlight squeezes (narrowing bands) that often precede breakouts.
- Confirm the Break Wait for a strong candle close beyond the level with above-average volume. Additional filters include rising ATR for volatility confirmation or alignment with the higher-timeframe trend.
- Entry Enter on the close of the breakout candle or on a minor pullback or retest for better risk-reward. For aggressive entries, buy or stop above resistance (long) or below support (short).
- Set Stop-Loss and Take-Profit Place stop-loss just beyond the opposite side of the range or use 1 to 1.5 times ATR below or above entry. Targets can be measured by the height of the consolidation range added to the breakout point, or trail stops using ATR multiples.
- Risk Management Risk no more than 1 to 2 percent of capital per trade. Avoid trading during low-liquidity periods or major news unless filtered.
Common Breakout Variations for Indices
Opening Range Breakout (ORB): Define the high or low of the first 15 to 30 minutes after market open, then trade breaks of that range. This proves popular for US30, NAS100, and S&P 500.
ATR Channel Breakout: Plot channels at entry price plus or minus multiples of ATR; breaks signal continuation.
Volatility Expansion: Enter when price moves more than 1 to 2 times ATR in one direction after quiet periods.
Risks and Tips
False breakouts are common, especially in ranging markets. Always wait for confirmation and use volume or ATR to filter. Indices can gap on news, so consider news filters. Backtest your setup on historical data for indices like S&P 500 or NAS100.
Conclusion
Mastering breakout strategies on indices requires patience, discipline, and consistent practice. By focusing on high-probability setups, confirming breaks with volume and volatility tools, and maintaining strict risk management, traders can position themselves to capture powerful trends in these dynamic markets. Start with a demo account to refine your approach, and over time, this method can become a reliable part of your trading arsenal.