The foreign exchange market or forex is different from most major markets in different ways. It has the highest trading liquidity on a daily basis compared to all other financial markets. It is active nonstop from 5 days a week. It attracts the highest number of retail traders. And so much more.

All these factors make forex one of the most volatile markets as well. But the thing about forex volatility is that it varies from big to extremely small. Currency pairs experience some degree of volatility almost all the time.
As we are moving forward in 2026 we can see even more uncertainty and volatility in other financial markets all around the world. So, it is a great time to take a look at the concept of volatility in forex, see what it means, how you can trade it, what indicators are best for it, and how you can protect yourself against it.
Understanding the 2026 Forex Market Context
There are so many different factors that have changed the nature of volatility in the forex market. In this section, we will take a look at the most important factors for forex volatility in 2026.
Geopolitical and Economic Drivers of Volatility
Smart traders in the forex market know volatility by heart. What does it mean? It means they know when it is coming so that they can expect it and trade it to their own advantage.
In order to truly learn volatility in the forex market you need to know the geopolitical and economic drivers that are behind it. These are perhaps the most important factors that cause volatility in the market.
At the end of the article, we will provide you two prominent examples of how such factors caused volatility in the market.
- Global Events: an excellent yet horrific example of a global event that happened recently is the pandemic that the world went through. At this time, most of its immediate impact is over. But when it hit the world, it disrupted the global supply chain, it caused massive inflation, it made huge changes in the labor markets around the world.
Translation? It caused heavy fluctuations in currency values all across the world.
- Central Bank Policies: the decisions that are made by the central banks around the world have a serious and quick impact on the value of currencies. You need to be always looking for such news. For instance, at the moment the UK central bank and also the European Union are both making changes to interest rates. There is no doubt it will and already has caused fluctuations in the value of GBP and EUR and their pairs in forex.
- US: we thought the United States deserves its own separate category for its huge impacts on the market! But in all seriousness, the US plays the most important role in the global economy and the decisions made by its administration must be followed by all serious traders.
Only in the first five months of 2026, the decisions of the US administration caused a plummet and then a revival in all major stock markets, completely disrupted the global supply chains through tariffs, heavily impacted the value of commodities such metals (gold, copper, silver, etc.), and various other goods.
Market Structure and Participant Evolution
As we said the forex market is the most liquid market in the whole world with the highest daily trading volume. This means the structure of this market can be quite complex. And there are various market participants that make up this market.
- Retail Trader Participation: retail traders make the largest number of traders in the forex market but not the trading volume. And the number of retail traders has always been on the rise and so far in 2026 it has been the same.
- Algorithmic and High-Frequency Trading: you also need to understand that the majority of all trading activity in the forex market is algorithmic and especially high frequency trading, which heavily relies on volatility.
- Regulatory Changes: look for the regulations that exist for forex trading in various regions and various currencies. Setting new regulations can cause serious volatility in how a currency pair is traded in the market.
These are some of the good factors for you to begin going deeper into how volatility is caused in the forex market. Remember, you should always keep yourself informed and educated on these matters.
What is Volatility?
In the forex market, volatility is the magnitude and frequency of price change during a certain time period. In simpler terms, volatility is the strength and speed of price change.
So it means how fast prices change and how strongly. There are different ways that we use to measure volatility. And we will tell you all about these different ways.
How to Check Volatility in Forex?
In this section we are going to go through all the different indicators that are useful for measuring volatility in the forex market. Different indicators mentioned here are used in combination with other indicators for different strategies.
But, it is still a good idea to get to know all of them.
Average True Range (ATR)
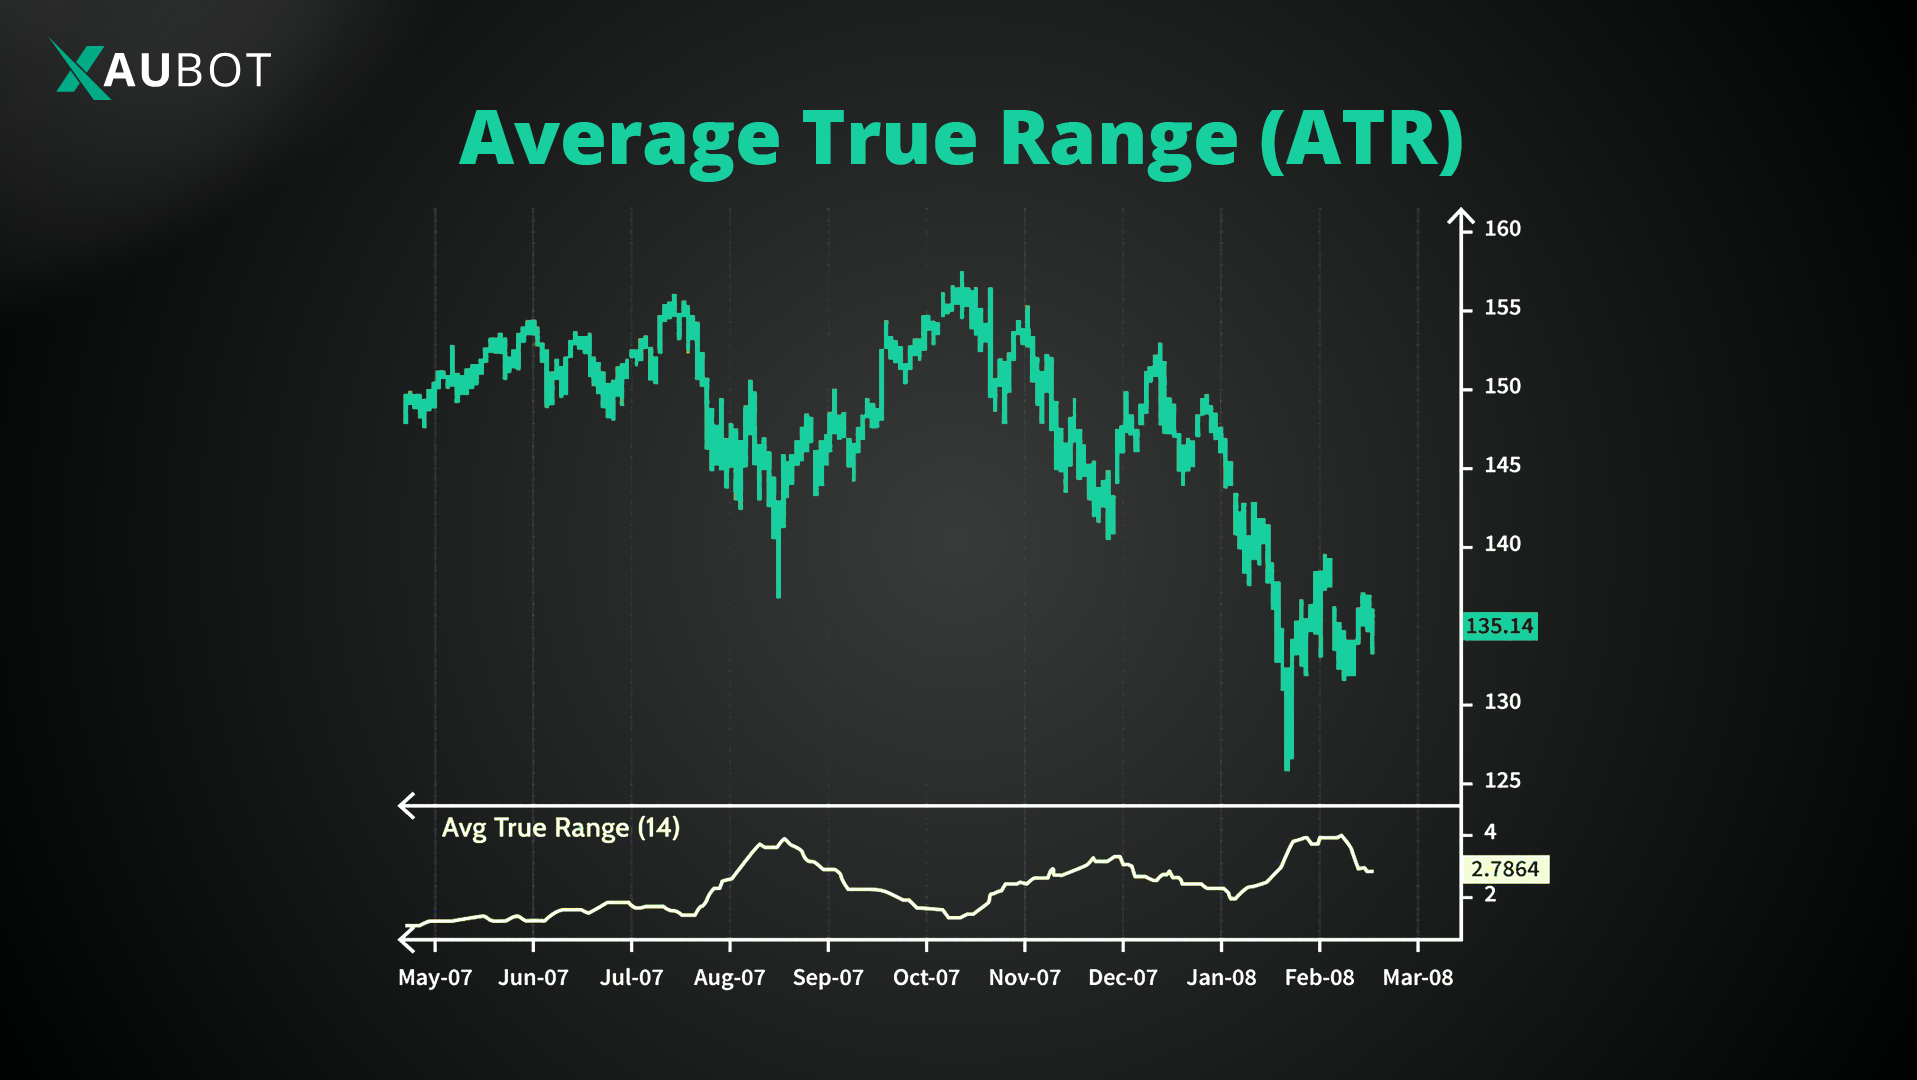
Overview: this indicator, which was developed by the prominent American mechanical engineer J. Welles Wilder Jr., measures the average price movements in a given time period.
Because it averages the daily price movement range, it provides users with an easier way to understand and read volatility on the chart.
Calculation:
- Let’s start with TR part of ATR, which is True Range:
- To get the true range, we first deduct current high from current low
(current high minus current low)
- Then we deduct the absolute value of current high from previous close
(current high minus previous close)
- Then we deduct the absolute value of current low from previous close
(current low minus previous close)
- And now it is time for the A or average. We take all the values above and divide by the number N which is time period (for example 14 for 14 days)
This is how ATR is calculated. Of course the process is fully automated these days and you will not need to do it yourself. But seeing how it is calculated can help you better understand it.
Trading application:
- When the value for ATR is increasing, it means volatility is increasing and a potential breakout might be close.
- When the value for ATR is low or decreasing, it means volatility is low or decreasing which happens especially when there is price consolidation.
Bollinger Bands
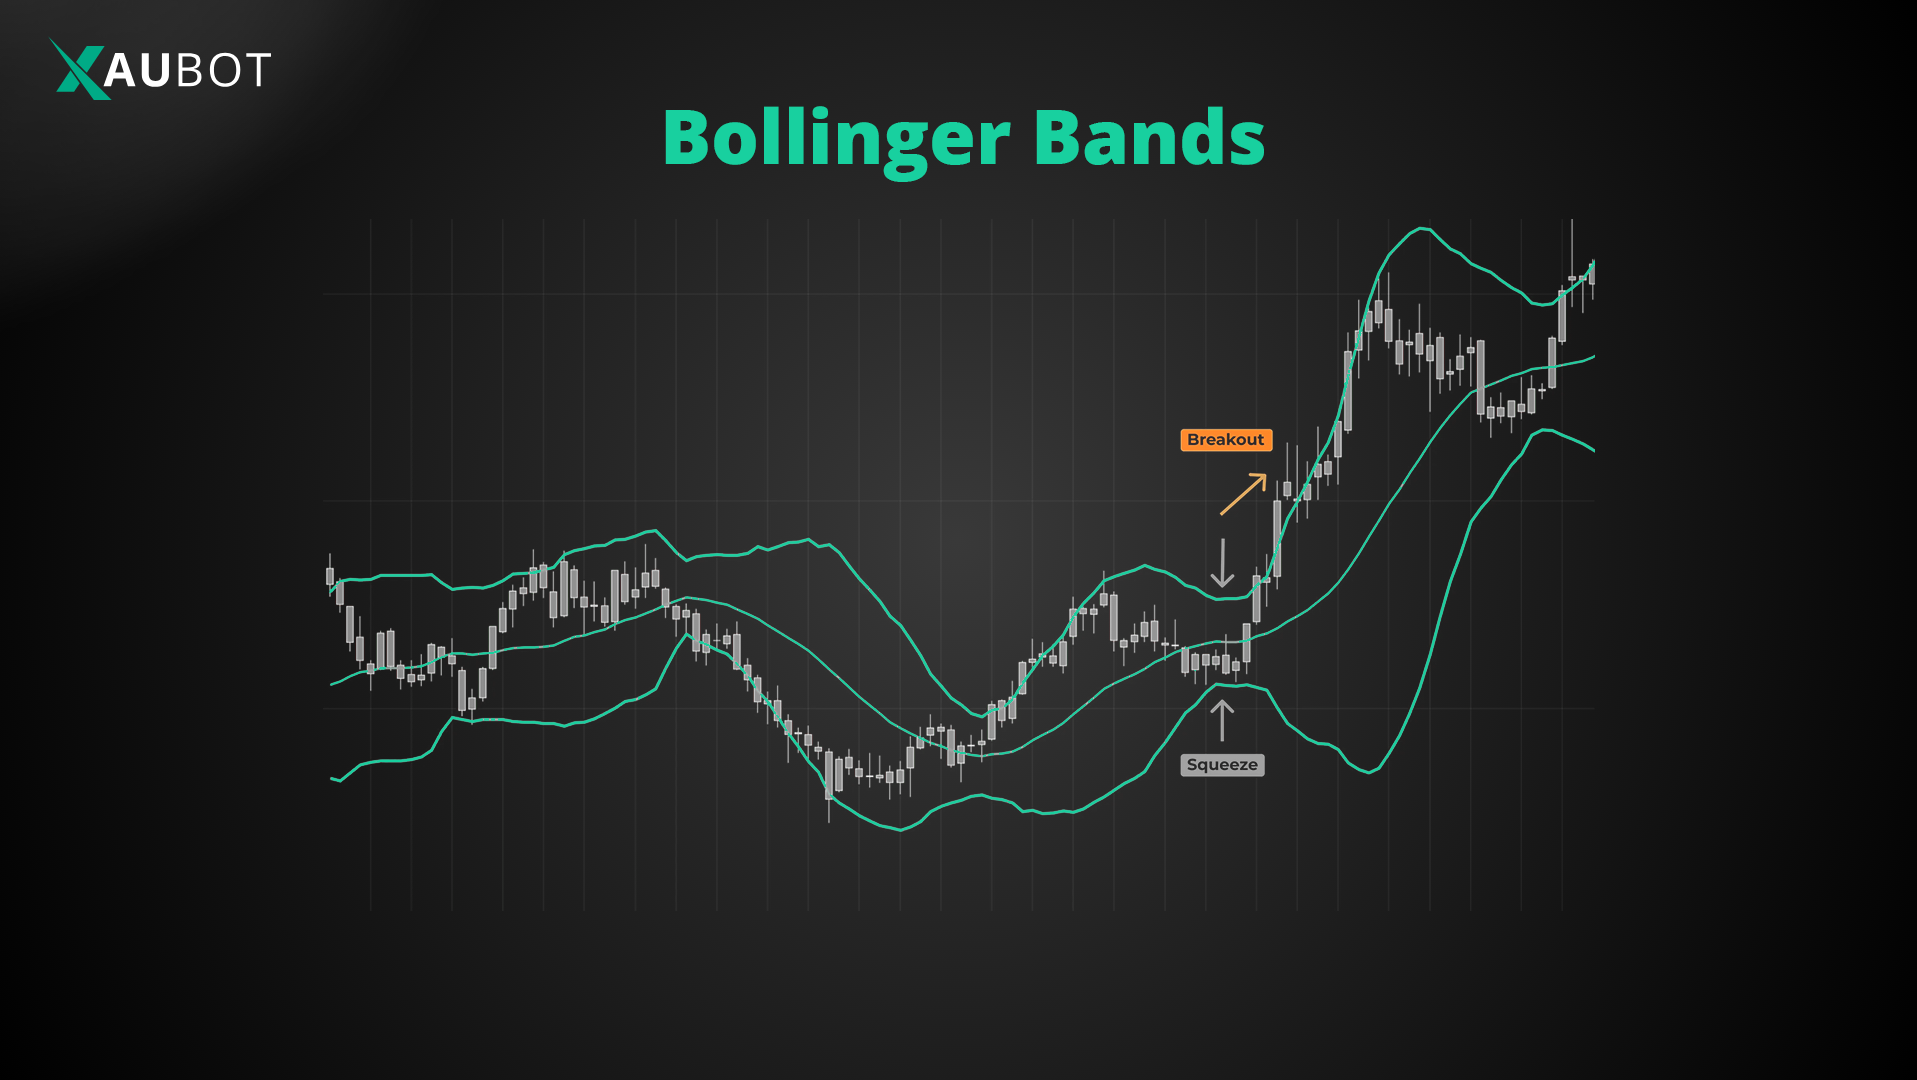
Overview: The Bollinger Bands is one of the most well-known technical indicators across all markets. Developed by the American financial analyst John Bollinger, this indicator uses a moving average and then two standard deviations above and below it (together 3 bands = Bollinger Bands)
It is one of the most powerful indicators used to measure volatility in the market.
Calculation:
- Middle Band: the middle band is usually a 20-period simple moving average (SMA).
- Upper Band: the upper band is calculated as middle band + 1 or 2 standard deviations
- Lower Band: the lower band is calculated as middle band – 1 or 2 standard deviations
Put together the form the so-called Bollinger Bands.
Trading application:
- When the Bollinger Bands expand it indicates higher volatility – this is usually the case following a breakout
- When the Bollinger Bands tighten it means lower volatility – this might be a strong sign for a coming breakout
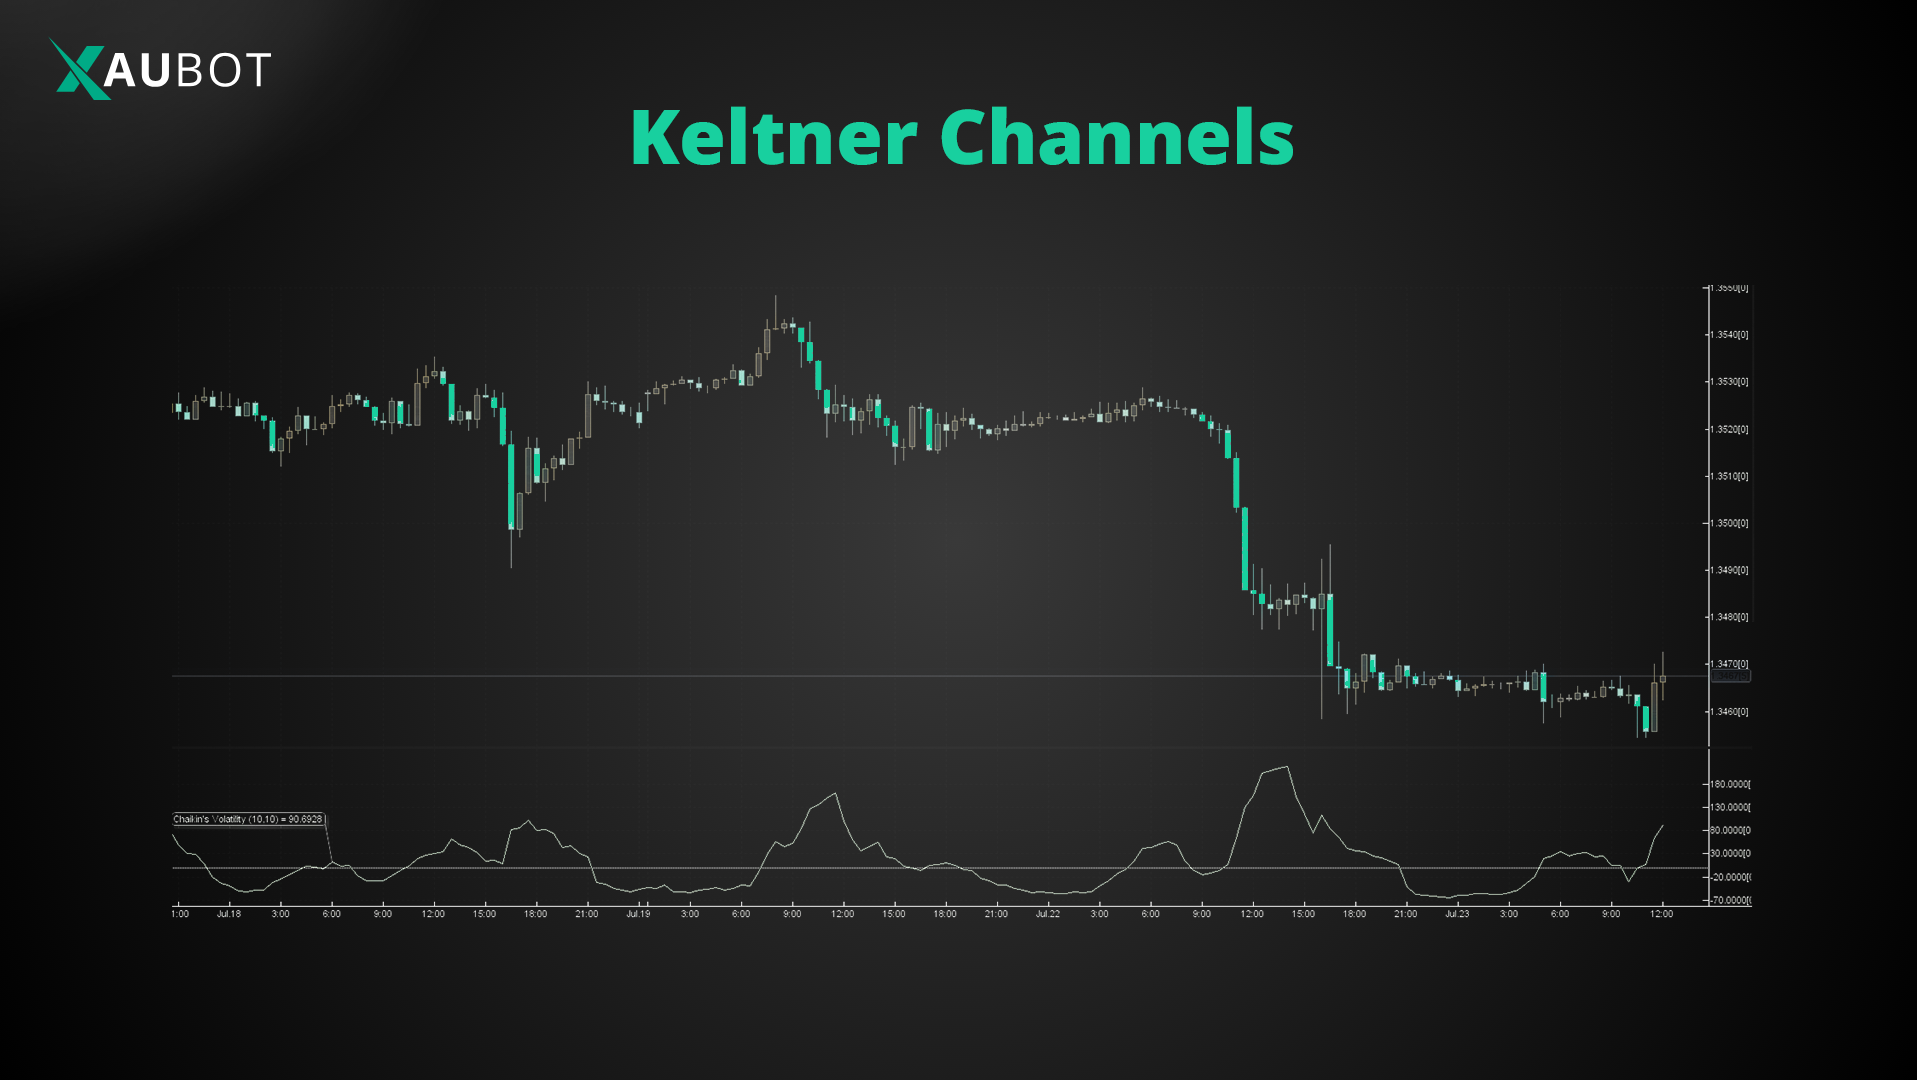
Keltner Channels
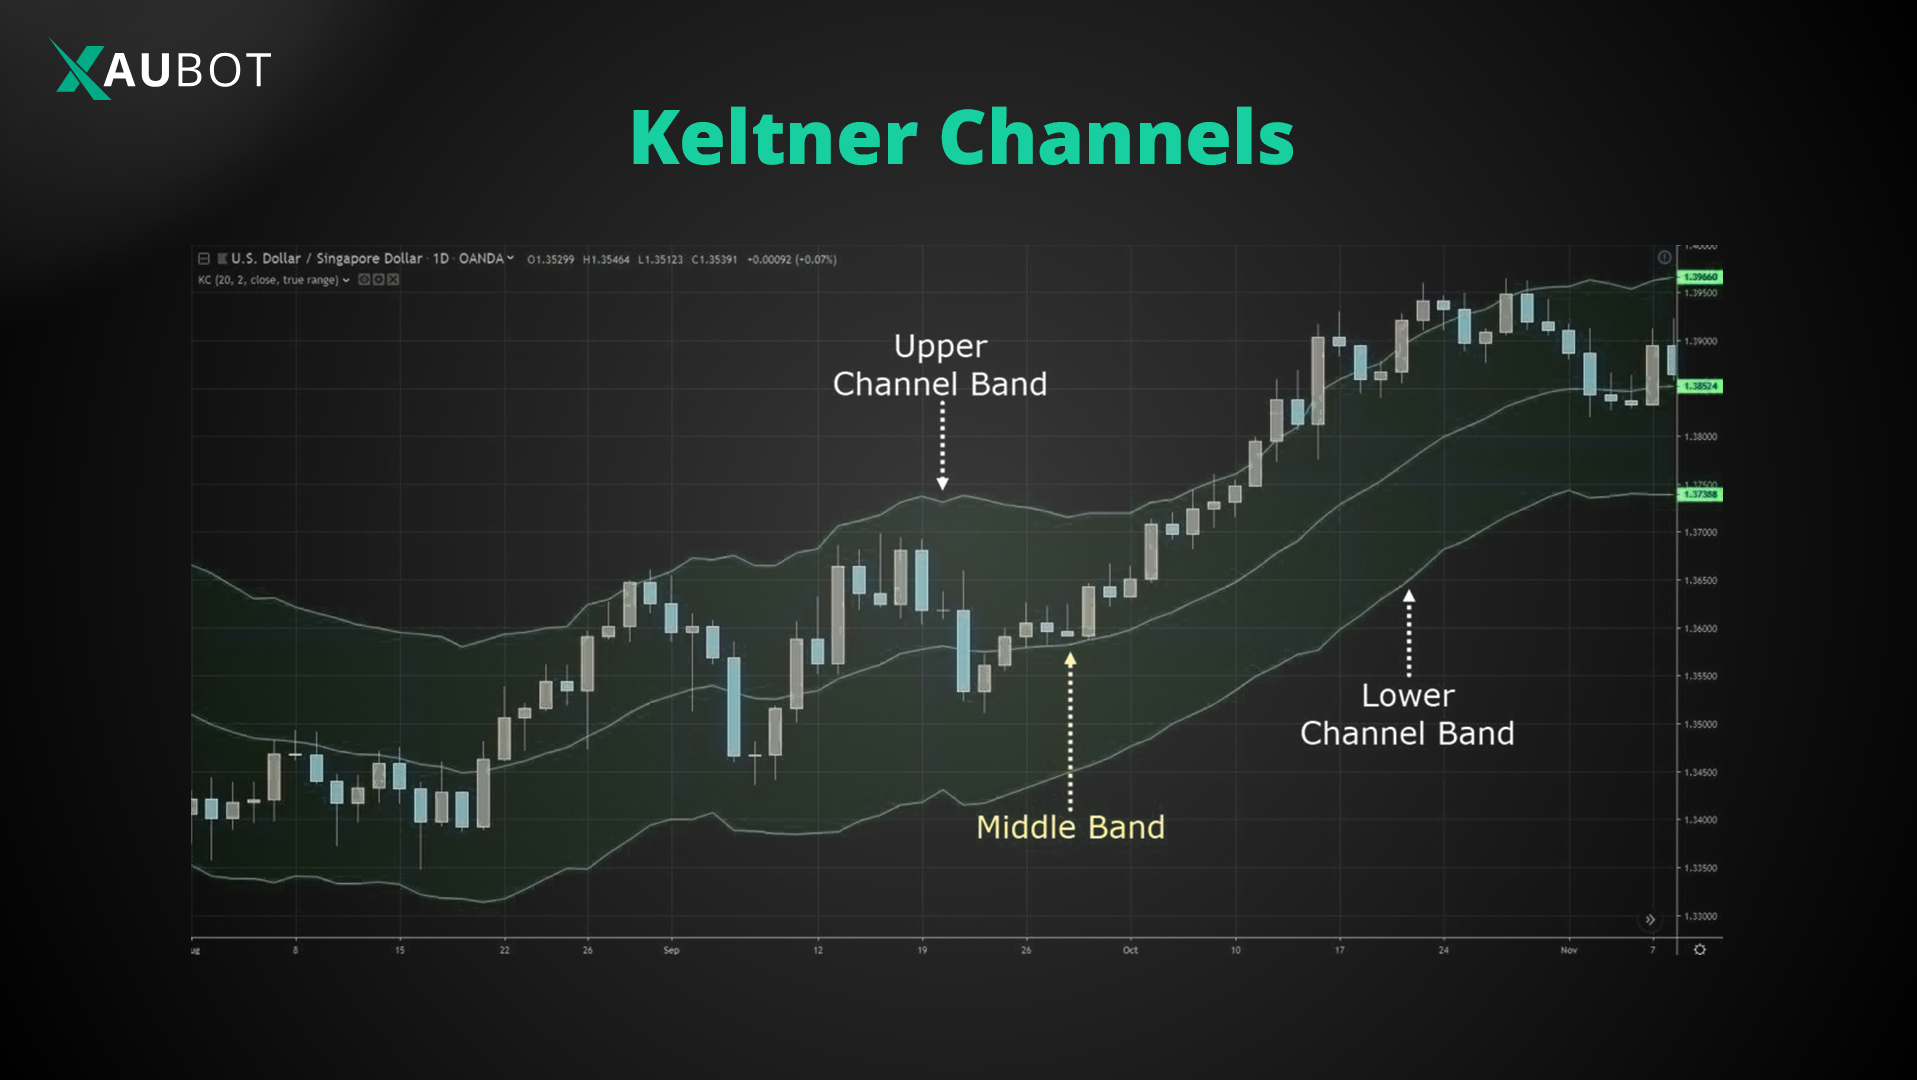
Overview: let’s get a bit more technical. This one is a little advanced so more experienced traders would usually use this one. The Keltner Channels are very similar to Bollinger Bands. They only have on difference:
The Bollinger Bands use standard deviations but the Keltner Channels use ATR.
Let’s see how.
Calculation:
- Middle Line: the middle band is a moving average, usually an Exponential Moving Average (EMA) typically over 20 periods.
- Upper Channel: the upper band is EMA + 1 or 2 ATR
- Lower Channel: the lower band is EMA − 1 or 2 ATR
Trading application:
- When the bands in the Keltner Channels expand it means a higher volatility
- When the bands in the Keltner Channels tighten it means lower volatility which could be a sign for a coming breakout
- Another use for the Keltner Channels is that traders might use it in combination with other indicators in order to confirm market volatility.
Donchian Channels
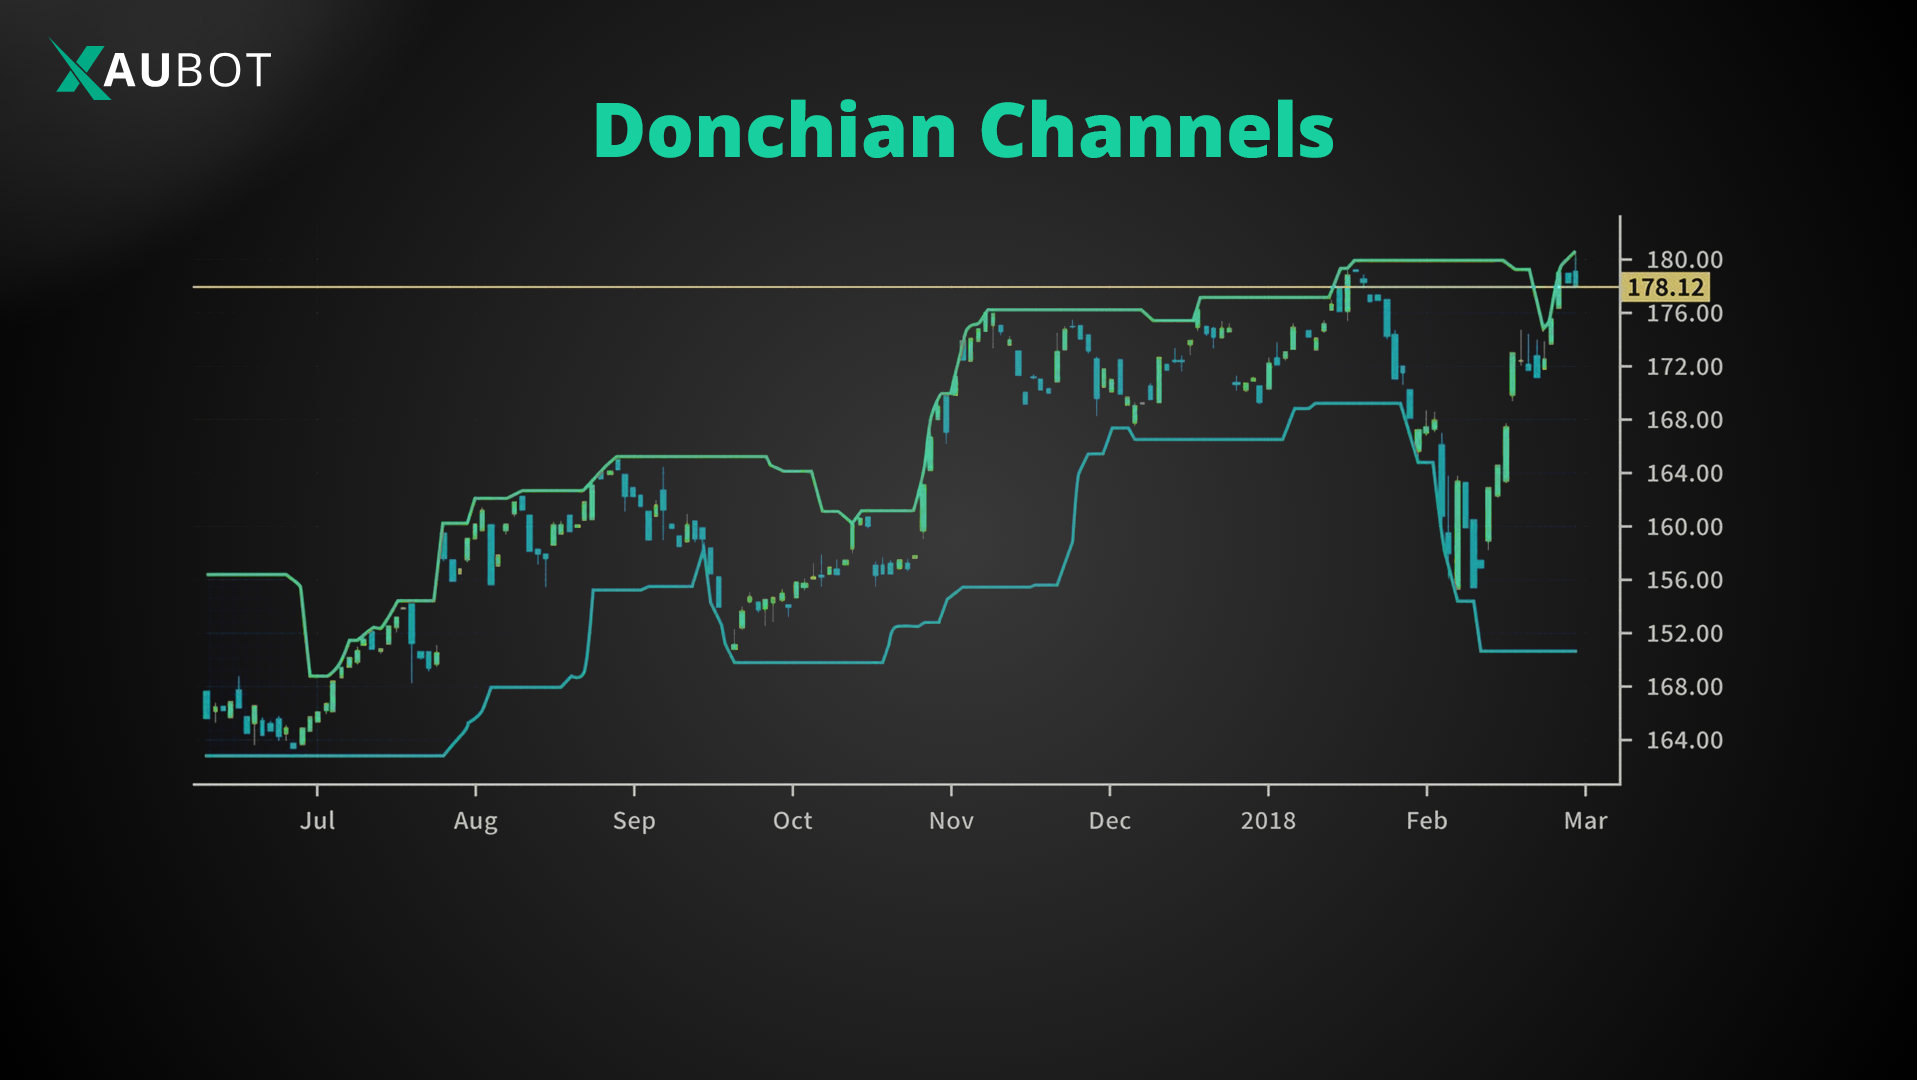
Overview: this indicator is very easy to understand and for these reasons it can be very useful for most traders.
The way it works is that it plots the highest high and the lowest low over N (time period).
So, here we have the highest prices and lowest prices divided by the time period. This gives us a quick and easy way to see price fluctuations in that time period.
Trading application:
- When the price moves above the upper band of the Donchian Channels it is a sign for bullish breakout.
- When the price moves below the lower band of the Donchian Channels it is a sign for bearish breakout.
Chaikin Volatility Indicator
Overview: this is another easy way to understand and see volatility on your chart as it is plotted on the bottom of the chart so you can see it as price progress. The Chaikin Volatility Indicator compares the difference between high and low prices over time to obtain volatility. So it is very simple yet very useful.
Trading application:
- Sharp increases in Chaikin Volatility is a clear sign of increasing volatility. Extreme highs can be a sign for price reversals.
- The lower value for Chaikin Volatility on the chart is also a clear sign for lower volatility.
- The Chaikin Volatility Indicator is also used a lot with other indicators to confirm the obtained signal.
Case Study 1: Brexit Referendum 2016
One of the best case studies for volatility in the forex market is related to the time period when the UK was deciding to pull out of the European Union. This was a huge thing. It means serious implications for both the GBP and also the EUR currency.
- As a result, we saw extreme volatility in GBP/USD but also other pairs involving GBP.
- Traders who were aware of this serious impact were able to trade the volatility during the event and also capitalize on the coming moves post Brexit.
Case Study 2: COVID-19 Market Crash 2020
But the biggest market crash (after the 2008 global market crash) was perhaps none other than the horrific pandemic that began in 2020. It was completely devastating for the global economy, the global supply chain, and impacted every single financial market.
- This period caused a sudden volatility spike across all forex pairs.
- Certain traders who anticipated this huge impact, such as scalpers, were able to profit heavily during this period.
Final Thoughts on Volatility in Forex
Understanding and using volatility in the forex market in 2026 is perhaps more important than ever. We have witnessed time and again how different events cause serious ripples in the market. In this article we took a deep look at the concept of volatility, what causes it, what it means, and the various indicators that are best for measuring it, including ATR, Bollinger Bands, and Keltner Channels.

