There are certain notions involved in forex trading that are so fundamental you would see them almost everywhere and with every analysis tool. Support and resistance levels or lines are exactly among those fundamental concepts. These two can be regarded as quite basic indicators that provide valuable insight into the behavior or prices and price movements. With the help of these two levels, traders in the forex market can make decisions about their positions, predict the market trend, anticipate reversals, potential consolidation points, and more. So, in this article we are going to discuss these two levels and see what they are and how they can be implemented in the process of trading.

What are Support and Resistance Levels?
Before talking about how one can use these two concepts in forex trading, we must first understand what they are.
Support: the name is quite telling for this phenomenon, so a support level is the level at which the price of an asset or a pair in the forex market will find support while it is falling down. So, imagine prices are falling and falling. At some point, either sellers can no longer push the prices down or buyers come in to help push price back up. Whatever it may be, the price hits a maximum bottom level that it does not pass, and that is the support level. You can kind of consider the support level as the floor.
- Resistance: then of course we have the resistance level. Similarly, as the name suggests, the resistance level is when rising prices are met with resistance and cannot be pushed higher. This is when buyers have a hold over the market and prices are being pushed upward. But then sellers find their sway and so the price hits a maximum level. That level is known as resistance, which can also be thought of as the ceiling.
So here we have the two concepts of support and resistance as the floor and ceiling of prices. But do keep in mind that these concepts are quite dynamic. There is never a fixed support or resistance level forever. We have these levels and we calculate them based on a certain time period.
Identifying Support and Resistance Levels
Now that we have an understanding of what these levels are, it is time to see how you can identify or calculate them. Being able to identify these two levels is an absolutely crucial skill that any forex trader needs to have.
There are various ways that can be used in order to identify or calculate these levels. Here are the most important and accurate ones:

Historical Price Action
The simples and easiest way is to look at the history of price movements for an asset or trading pair in forex. You can easily find out where the price has historically hit a floor or a ceiling so-to-speak and figure out the overall and general support and resistance levels this way to get a gist of the maximum high and low potential of the asset.
- Support: to find out this level you can look for the lowest points from which prices have bounced back up again
- Resistance: on the contrary, to find this level you need to look for high areas which the asset has touched but has not surpassed
Swing Highs and Swing Lows
You can also look for the swing highs and swing lows. These are the highest and lowest points that prices can reach during a trend. So, look for trends in the market, historically speaking, and then look for the price swings and see what they reach or fall to.
Trendlines
Trendlines are basically averaged out lines that present the trend of prices. You can follow the trendline and look for areas where they reach high or fall low. By following the trendline you can get a gist of the overall support and resistance levels.
- In an uptrend, the trendline can act as a rising support level.
- In a downtrend, the trendline can act as a falling resistance level.
Fibonacci Retracement Levels
Another quite popular but rather complex method to find out support and resistance levels is to use the formula known as Fibonacci retracement levels. Of course, this formula is based on the well-known Fibonacci numbers and the relevant sequence in terms of percentages, i.e. 23.6%, 38.2%, 50%, 61.8%, and 100%. The Fibonacci retracement levels can help traders find these two levels of support and resistance as well as where the potential areas for reversal might be.
Moving Averages
While traditionally they are not used for identifying support and resistance levels per se, we can also rely on moving averages to get a picture of how these two levels are moving and also how they are forming. A moving average can be the average for any time period, i.e. 50-day, 100-day, or 200-day, etc., and we can use them during an uptrend by following it to trace the potential resistance and vice versa when there is a downtrend.
How to Use Support and Resistance Levels in Forex Trading
So far, we have covered the concepts of support and resistance levels and we have also talked about how it is possible to identify them through various means. Now it is high time to discuss what you can indeed do with this information. So, without further ado, here are some tips on how to use support and resistance levels in forex trading.
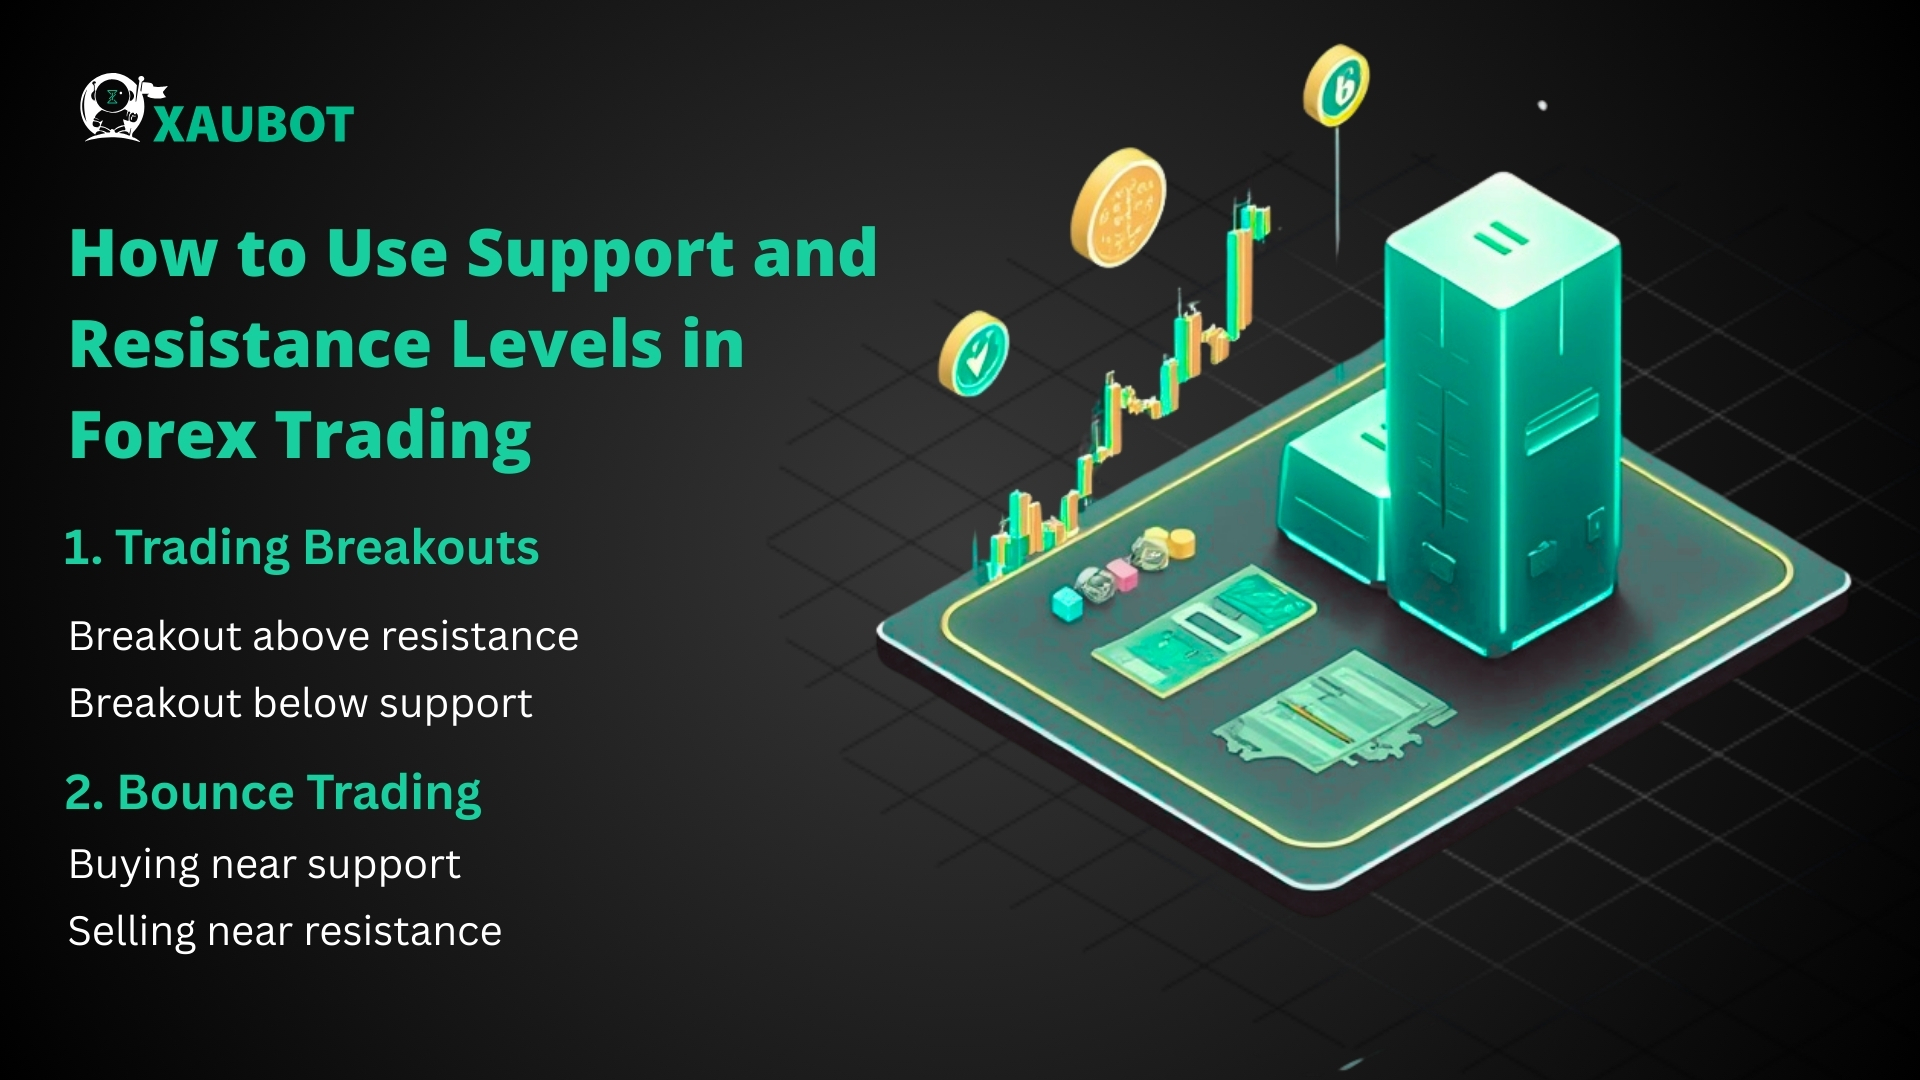
Trading Breakouts
This is perhaps the most important way that you can use support and resistance levels. In simple terms, a breakout is when the price breaks the line or threshold for either the support or resistance levels. That is when we say a breakout has occurred. We can use these moments to our advantage and base our new positions on them. Let’s take a look at both resistance and support line breakouts below:
- Breakout above resistance: when we have identified a resistance level and the price breaks through that line, it is clearly indicating that buyers have outpowered sellers and have gone beyond the established resistance level. In this situation you can expect a bullish trend to be on its way. As such when this happens, you can opt for long positions or buy.
- Breakout below support: on the contrary, when falling prices break through the support level, then it clearly indicates that sellers have gained even more power in the market and prices have become weaker than already anticipated. So, when there is a breakout of the support line, it is a good idea to opt for short positions or sell.
Please do keep in mind that these are generalized approaches regarding when they present themselves to traders. It does not mean that 100% of all resistance breakouts will lead to a full force bullish trend and it also does not mean that 100% of all support breakouts will eventually become another bearish run. You need to approach price and market analysis from several angles in order to make sure you have enough confirmation about what is going to happen and do not rely on a single method of analysis.
Bounce Trading
Another method in which support and resistance lines can be used in forex trading is known as bounce trading. The idea is to use the areas at which price gets close to either support and resistance level and base your decision off of those areas. Let’s take a more detailed look as follows:
- Buying near support: having identified the support level, you can use that as the baseline for going long. The way it works is very straightforward. When the price is getting close to the support line, you can opt for long positions or buy. This is in anticipation that the price is about to bounce back up. So in this way you can buy low and sell high.
- Selling near resistance: this is of course the opposite of the method above. In this method you would use the resistance line as the baseline for going short or sell. So when the price is getting close to the resistance line, you can opt to sell or go short. This is in anticipation that the price is as high as it gets and it is about to bounce back down.

