There are some numbers you just should not forget. For example, your loved ones’ birthdays, special holidays, important phone numbers, and of course, the Fibonacci sequence!

Well, lucky for you, unlike its complex infinite nature, you don’t actually have to memorize the Fibonacci sequence. You can calculate it yourself. In the Fibonacci sequence each number is the sum of its two previous numbers.
Obviously, starting from 1, we would have something like this: [1, 1, 2, 3, 5, 8, 13, 21, 34, …]
But what do all of these numbers have to do with forex?
There is something known as the Fibonacci retracement levels which are clearly based on the famous Fibonacci sequence.
Fibonacci retracement levels can provide valuable and crucial information to forex traders with regard to possible support and resistance levels.
Quick History Lesson: The Origin of Fibonacci
As discussed earlier, the Fibonacci sequence is actually among the most well-known numbers. This is why they are also known as the golden ratio, which is a ratio taken from the numbers in this sequence.
The reason it is known as a golden ratio is that they are found and manifested in different places in nature. Including countless geometric shapes, galaxies, stars, and even the DNA.
Of course the Fibonacci sequence were discovered by the scientist with the same name – i.e. Leonardo Fibonacci, the renowned Italian mathematician.
However, historically speaking, due to the significance and prevalence of these numbers, it is believed that they had been discovered centuries prior to Leonardo Fibonacci by Indian mathematicians.
Whatever these stories are, they just go to show you how important and universally essential the numbers in the Fibonacci sequence are.
And of course they play an important role in the analysis of financial markets, including the forex market.
So, let’s find out what Fibonacci numbers can do for forex traders.
What Exactly Are Fibonacci Retracement Levels?
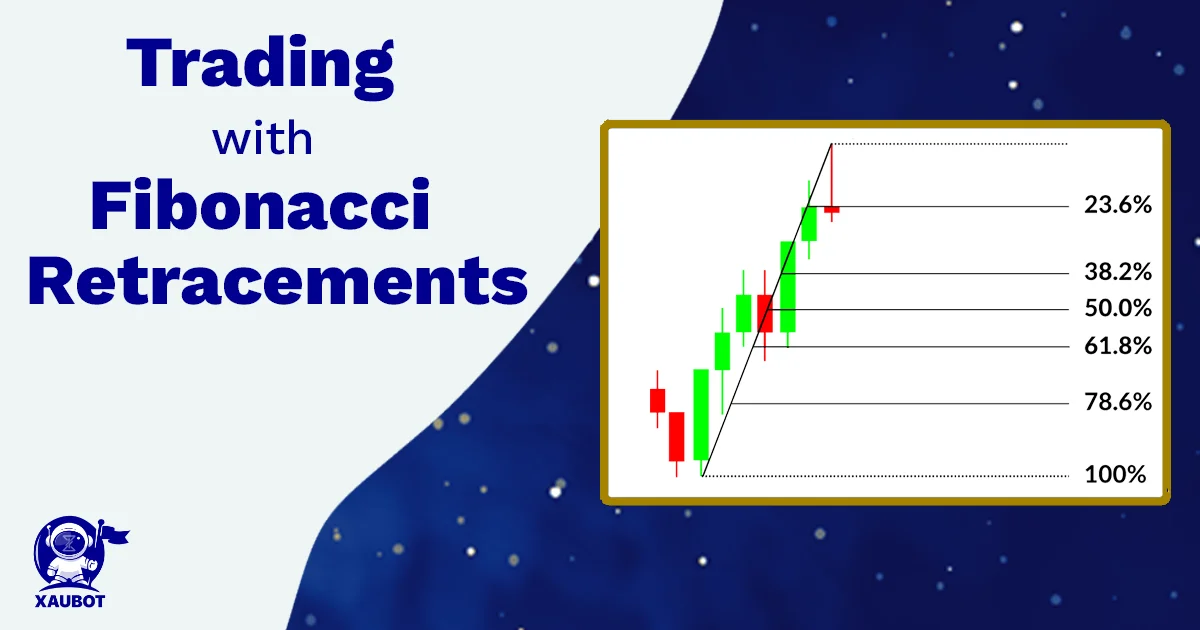
The Fibonacci retracement levels are made of horizontal lines. It is actually these lines that can show the support and resistance levels to traders.
Remember the golden ratio we talked about earlier? These ratios are derived from not adding but actually the division of the Fibonacci numbers. As such the following ratios are obtained: 23.6%, 38.2% 61.8%, and 78.6%. All of these ratios are part of the Fibonacci retracement levels in addition to the 50% ratio, which itself is not derived from the Fibonacci sequence, but it is used nonetheless.
So what do these numbers or ratios indicate? These ratios show us how much the price has retraced compared to its prior position.
As we will see in the next section about calculation and application, the Fibonacci retracement levels do not actually have a certain formula. In fact, they can be placed and drawn based on any two points on the chart.
In general, the Fibonacci retracement levels can provide us with information regarding support and resistance levels. But we will also discuss the application further in coming sections. First, let’s talk about calculations.
How to Calculate Fibonacci Retracement Levels?

how to calculated fibonacci retracement level?
In the Fibonacci retracement levels, we do not use the Fibonacci numbers directly. However, we use ratios that are derived from these numbers.
But how?
We know what the sequence of numbers looks like. Give the sequence of numbers being as [1, 1, 2, 3, 5, 8, 13, 21, 34, …] if you divide each number by its adjacent number to the right, then divide the same number by the two letters to its right, and so on, you will get ratios as 0.236, 0.382, 0.618, and 0.786.
Don’t forget that we also use the 0.5 ratio, even though it technically doesn’t come from the Fibonacci sequence.
So we know the ratios. How do we apply them to our chart?
Of course, there is not a fixed formula for the Fibonacci retracement levels. You can pick any two points on the chart and then draw these levels based on them. Because the Fibonacci retracement levels will be mere percentages that range across these two chosen points.
Suppose you are trading a certain pair in the forex market, for example XAU/USD, which is gold denominated by US dollar, and the hypothetical price goes from $2,000 to $2,050.
If these two are the points that we have chosen for the retracement levels, then the following ratios will be obtained for these percentages:
- 23.6% = $2,050 – ($50 × 0.236) = $2,038.2
- 38.2% = $2,050 – ($50 × 0382) = $2,030.9
- 50% = $2,050 – ($50 × 0.5) = $2,025
- 61.8% = $2,050 – ($50 × 0.618) = $2,019.1
- 78.6% = $2,050 – ($50 × 0.786) = $2,010.7
So, these are the retracement percentages and their exact dollar amount for the XAU/USD pair with a hypothetical price increase of $2,000 to $2,050.
How to Interpret Fibonacci Retracement levels?
The Fibonacci retracement levels can be interpreted and used in many different ways or rather for many different purposes. In this section we will examine the different ways in which these levels can be used by forex traders.
A forex trader can use the Fibonacci retracement levels to find out the proper points of entry, to set out stop loss, and even what the suitable target for prices should be. Let’s use the same example as above. If, for example, the XAU/USD pair goes from $2,000 to $2,050 it is clearly indicative of an upward trend. But then the prices could retrace to around $2,030 which is in line with the Fibonacci ratio of 38.2%. The trader can then pick this point as a proper point of entry to take a long position. Or rather use this point as a good stop loss level. Because if you choose a Fibonacci ratio as your entry point, it might as well be used as your stop loss too. Since if prices move below this ratio, then you would incur losses.
Basically, as it was touched upon at the beginning of this article, the Fibonacci retracement levels are mostly used to indicate support and resistance levels. As such they are more appropriate when the market is trending. This trend could be an upward trend or a downward trend.
In the case of the upward trend, as the example above showed, when the prices retrace to a Fibonacci level, the trader can take a long position or buy.
On the other hand, on a downtrend, when prices retrace to a Fibonacci ratio, which in this case would be a resistance level, then it would behoove the forex trader to take a short position or sell.
However, it must also be mentioned that similar to almost all analysis tools and technical indicators that are widely used in the forex market, it is also recommended that the Fibonacci retracement levels be used in combination with other methods and techniques for a more accurate result.
Conclusion
The Fibonacci retracement levels are among the most useful and practical tools to find support and resistance levels in the forex market and then make decisions based on those two levels.
Of course, based on the namesake of this method, these levels are derived from the Fibonacci sequence.
One special feature of the Fibonacci retracement levels is that they are very simple to use. Because unlike many methods that are used to analyze the market such as moving averages, which are by nature moving and dynamic, the Fibonacci levels are static. This means they are not only easy to apply but also very easy to read and provide valuable information for forex traders.

