Sitting in the throne of all market analysis is of course technical analysis, which is the most widely used and also widely known form of price analysis. In technical analysis we take the patterns that manifest themselves in the market and evaluate them in order to make predictions about potential future price movements that could occur in financial instruments, which are foreign currencies in the case of forex.
The tools or formulas that are in technical analysis are known as technical indicators. These indicators are sort of the bread and butter of any trader in the decision-making process. So given the importance of technical analysis in forex, we are going to delve deep into this topic in this article and provide you with a comprehensive beginner’s guide to technical analysis.
Understanding Technical Analysis
The basic idea behind technical analysis is actually quite elegant. The idea posits that historical patterns and price movements are the holders of incredibly valuable information. Why? Because they can potentially foretell with regard to the upcoming patterns and price movements that will manifest themselves in the future.
Of course, the other side of the analysis coin is fundamental analysis where we mainly focus on fundamental factors such as news events, economic factors, and other external factors to the market. But in technical analysis only the things happening in the market, i.e. price movements and trade volume, are taken into account for analysis.
So, the idea behind technical analysis is that all the information you need in order to derive valuable insight about future movements in the market is already there in the historical records. By relying on these historical records, traders are able to draw out potential future patterns and rely on them to make their decisions on how to move forward and what positions to open.
The Basics of Forex Trading
Since we are covering the basics of technical analysis in forex, it is a good idea to take a cursory glance at the basics of forex trading as well to have a better understanding of the entire picture.
- Currency Pairs: in any financial market, we trade the financial instruments listed in that market. The financial instruments in the forex market are currency pairs. As the name suggest, a currency pair is made from two currencies – thus a pair. The pairs are denominated by each other so speculate on the price of each currency against another. Some examples of currency pairs include GBP/USD and EUR/USD.
- Bid and Ask Price: these two notions are very important because their difference forms the figure for spread. Bis is the price at which you can sell a currency pair or short it and ask is the price at which you can buy a pair or long it.
- Leverage and Margin: leverage is another important notion in forex trading which basically means the amount of money or leverage that the broker will lend you for trading in exchange for margin which is basically the collateral in the form of your account’s balance.
Now that we have covered some basic grounds in forex trading, let’s continue our discussion and go deeper into technical analysis.
Key Principles of Technical Analysis
Behind the mechanism of how technical analysis works is the idea that the market tends to repeat itself in terms of the patterns that it forms. Although this notion itself is rather simple and elegant in how it is straightforward, the actual analysis can be quite complex. So, in order to ease our way into the complexities of technical analysis, let’s first discuss the main principles that are involved in it:
- Price Minus Everything: price is the crux of analysis in technical analysis. The idea here is that all the other external factors that are involved in fundamental analysis, such as economic events and indicators, news, geopolitical events, etc., which do indeed impact prices, have already done so and therefore we need only focus on the price itself and what it reflects at any given moment. Thus, in technical analysis we believe that through the study of the price behavior we can obtain insights into future price behaviors.
- Price Moves in Trends: the notion of a trend is crucial as well in technical analysis. A trend is basically the general trajectory of movement of prices. So, this means the trajectory of prices can either be upward or bullish, downward or bearish, or without any discernible trajectory which means they are just moving sideways.
- Historical Trends: one last crucial, fundamental principle of technical analysis is that historical trends might well be over but should not be overlooked at all. The idea here is that historical trends tend to repeat themselves as well as they do in almost all markets. So, the forex market is no exception here and historical trends are similarly quite valuable.
Chart Types in Technical Analysis
There are so many tools that are involved in technical analysis. One class of these tools are the charts that are the visual representation of important data such as the current price movements and also historical price movements. There are three main chart types:
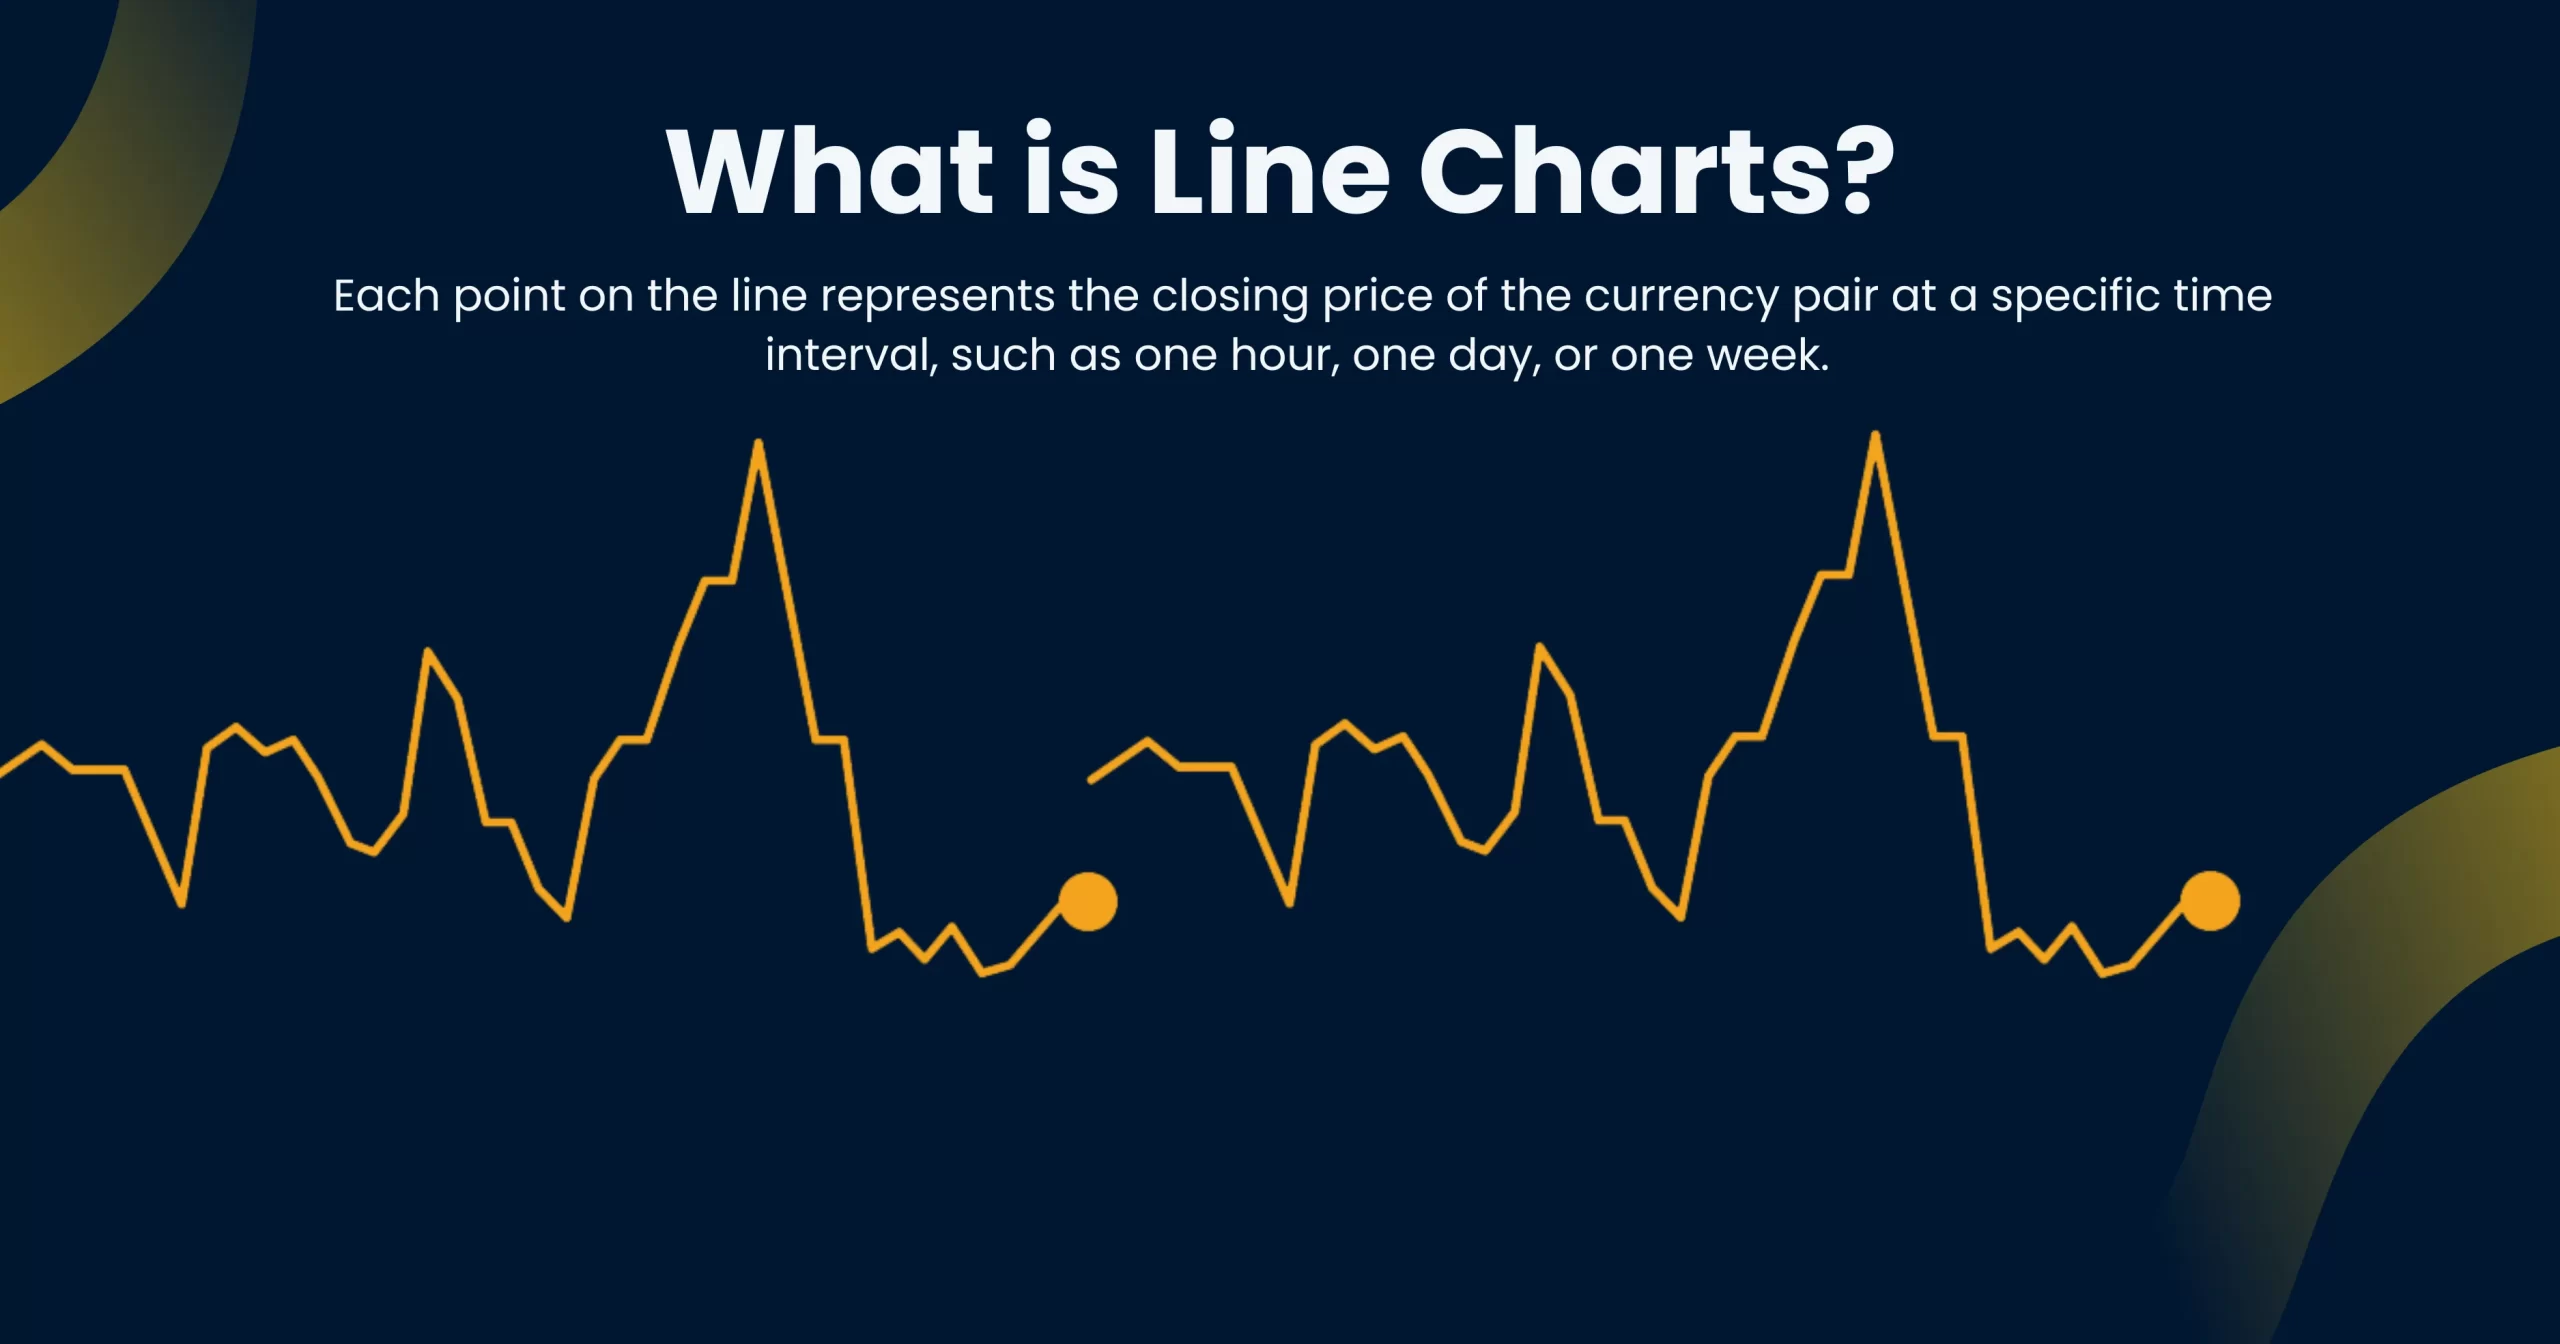
- Line Charts: the line charts are the simplest form of chart which, as the name suggests, uses a line to represent price movements. They are also used a lot in many of the other tools or indicators that are involved in technical analysis, such as moving averages. As you can guest, a line is great for showing average prices over a period of time. They are also used in many other cases to help with price analysis through indicators.

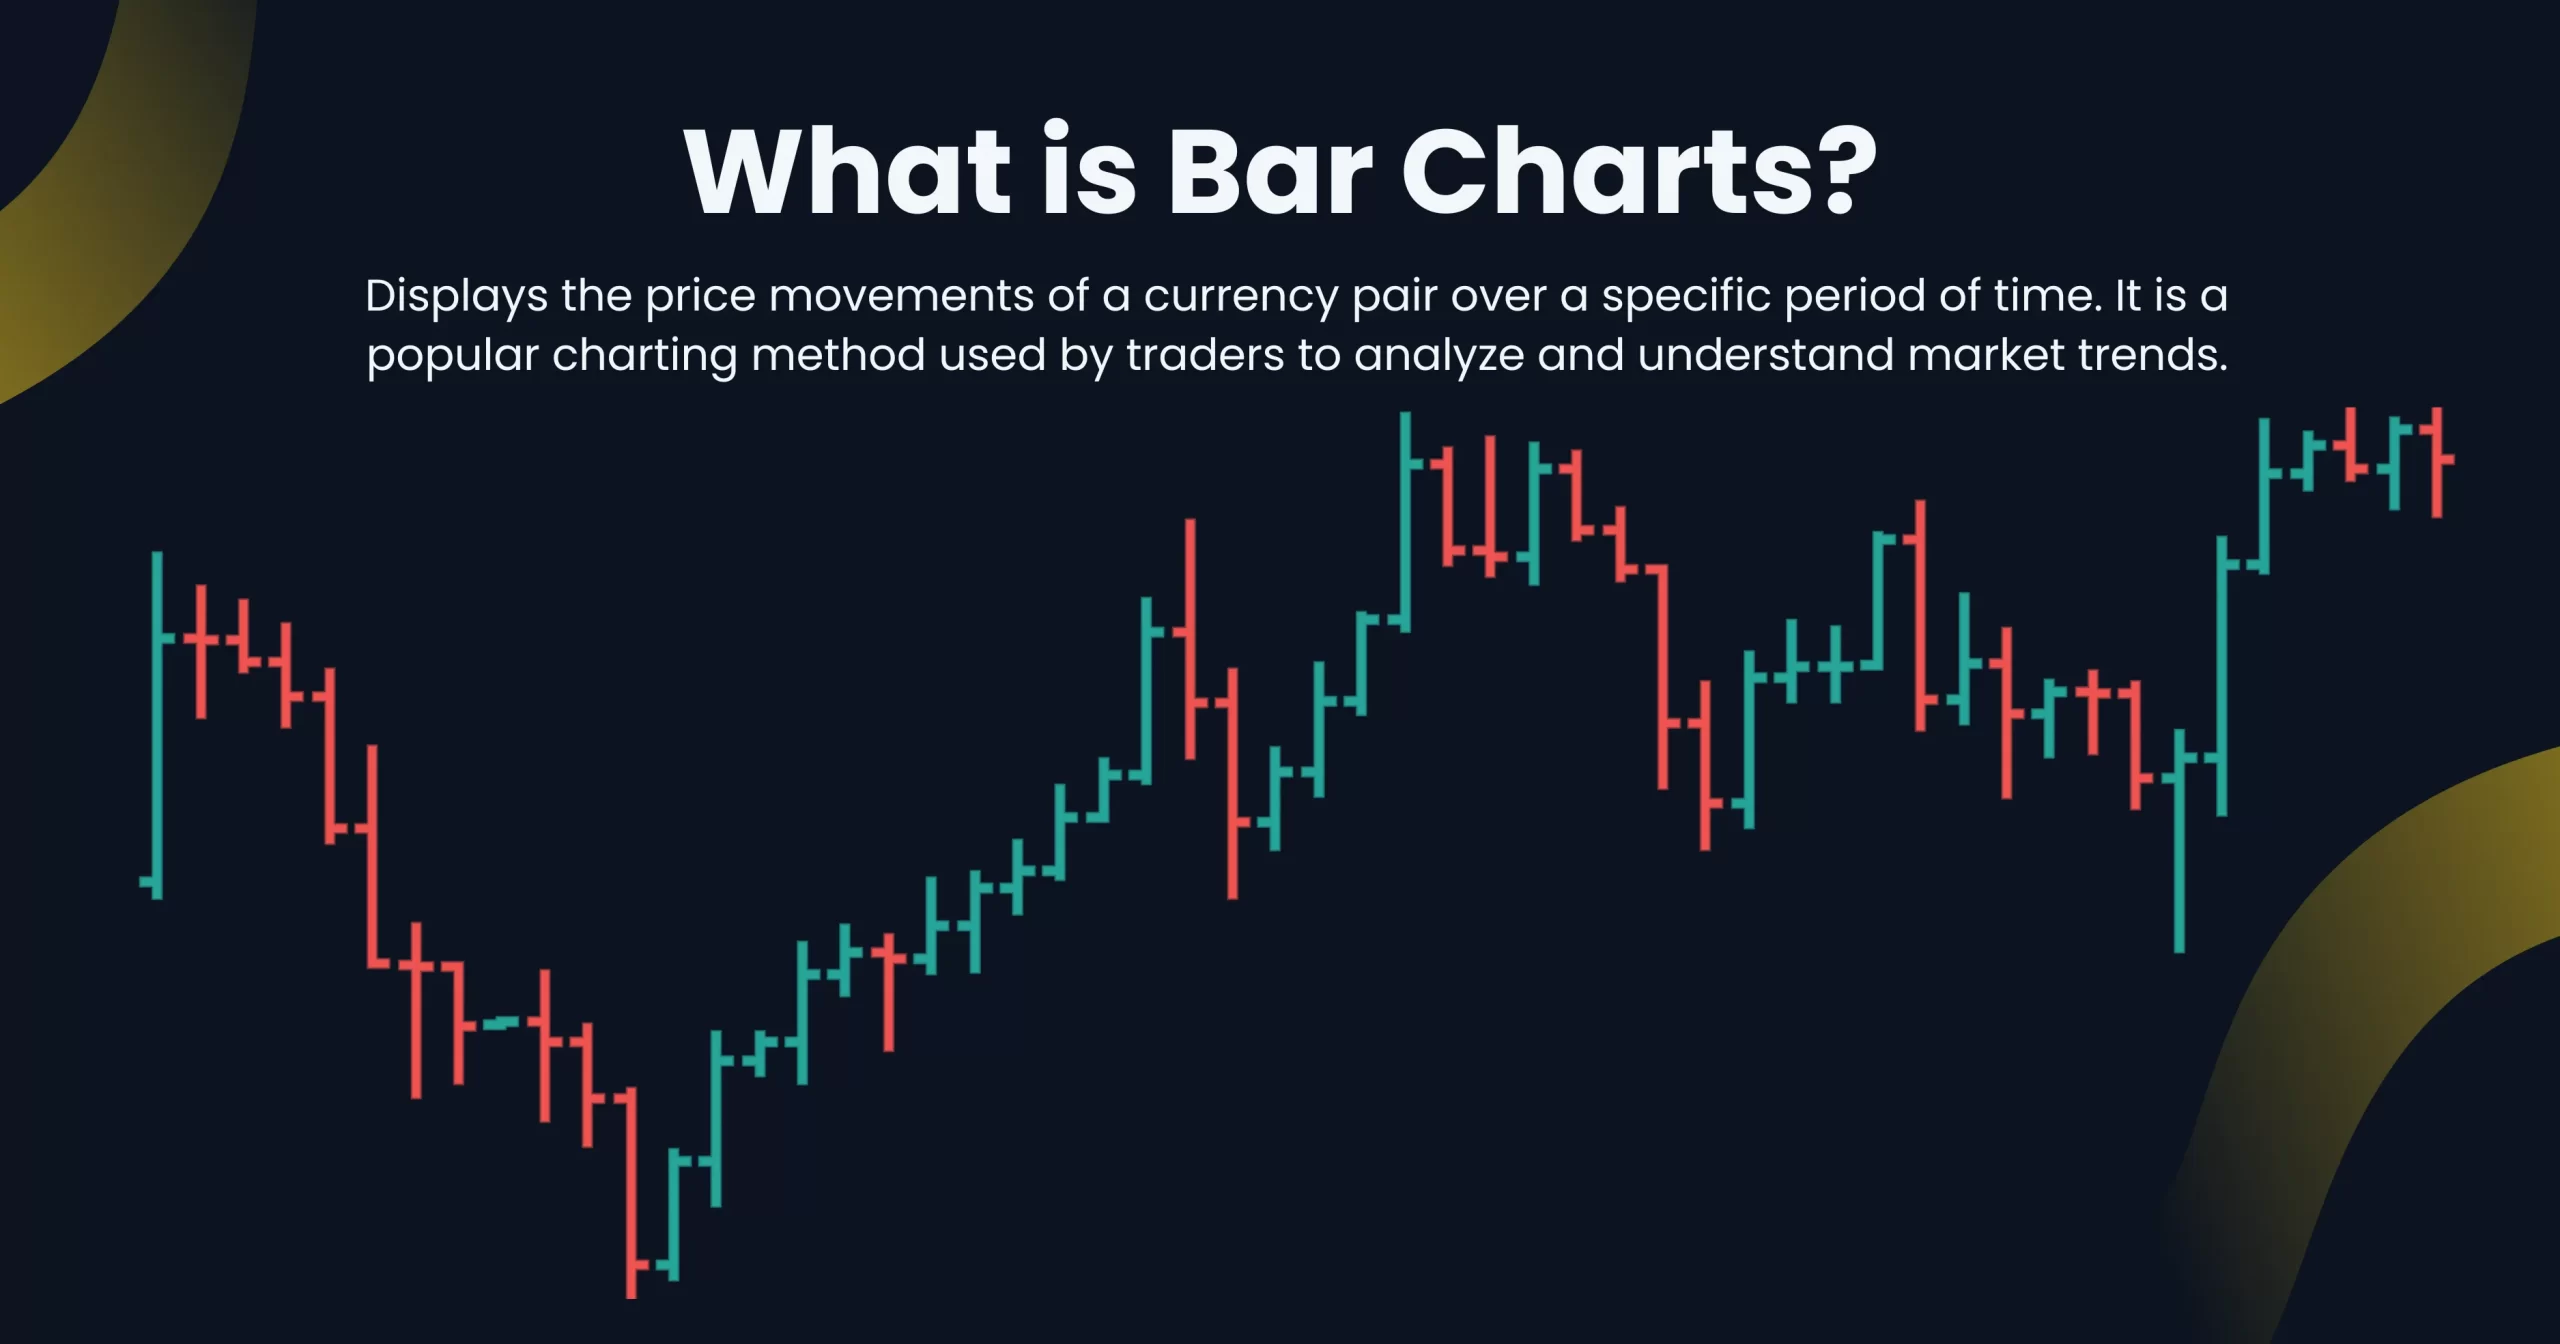
- Bar Charts: next we have bar charts which use bars for price representation. But these bars hold more information than simple lines in line charts. The bars in bar charts present information such as the opening price, high, low, and also the closing price of an asset or a currency pair in the given time period, which is usually a day. So, this chart type is a great way to understand price volatilities in the market.

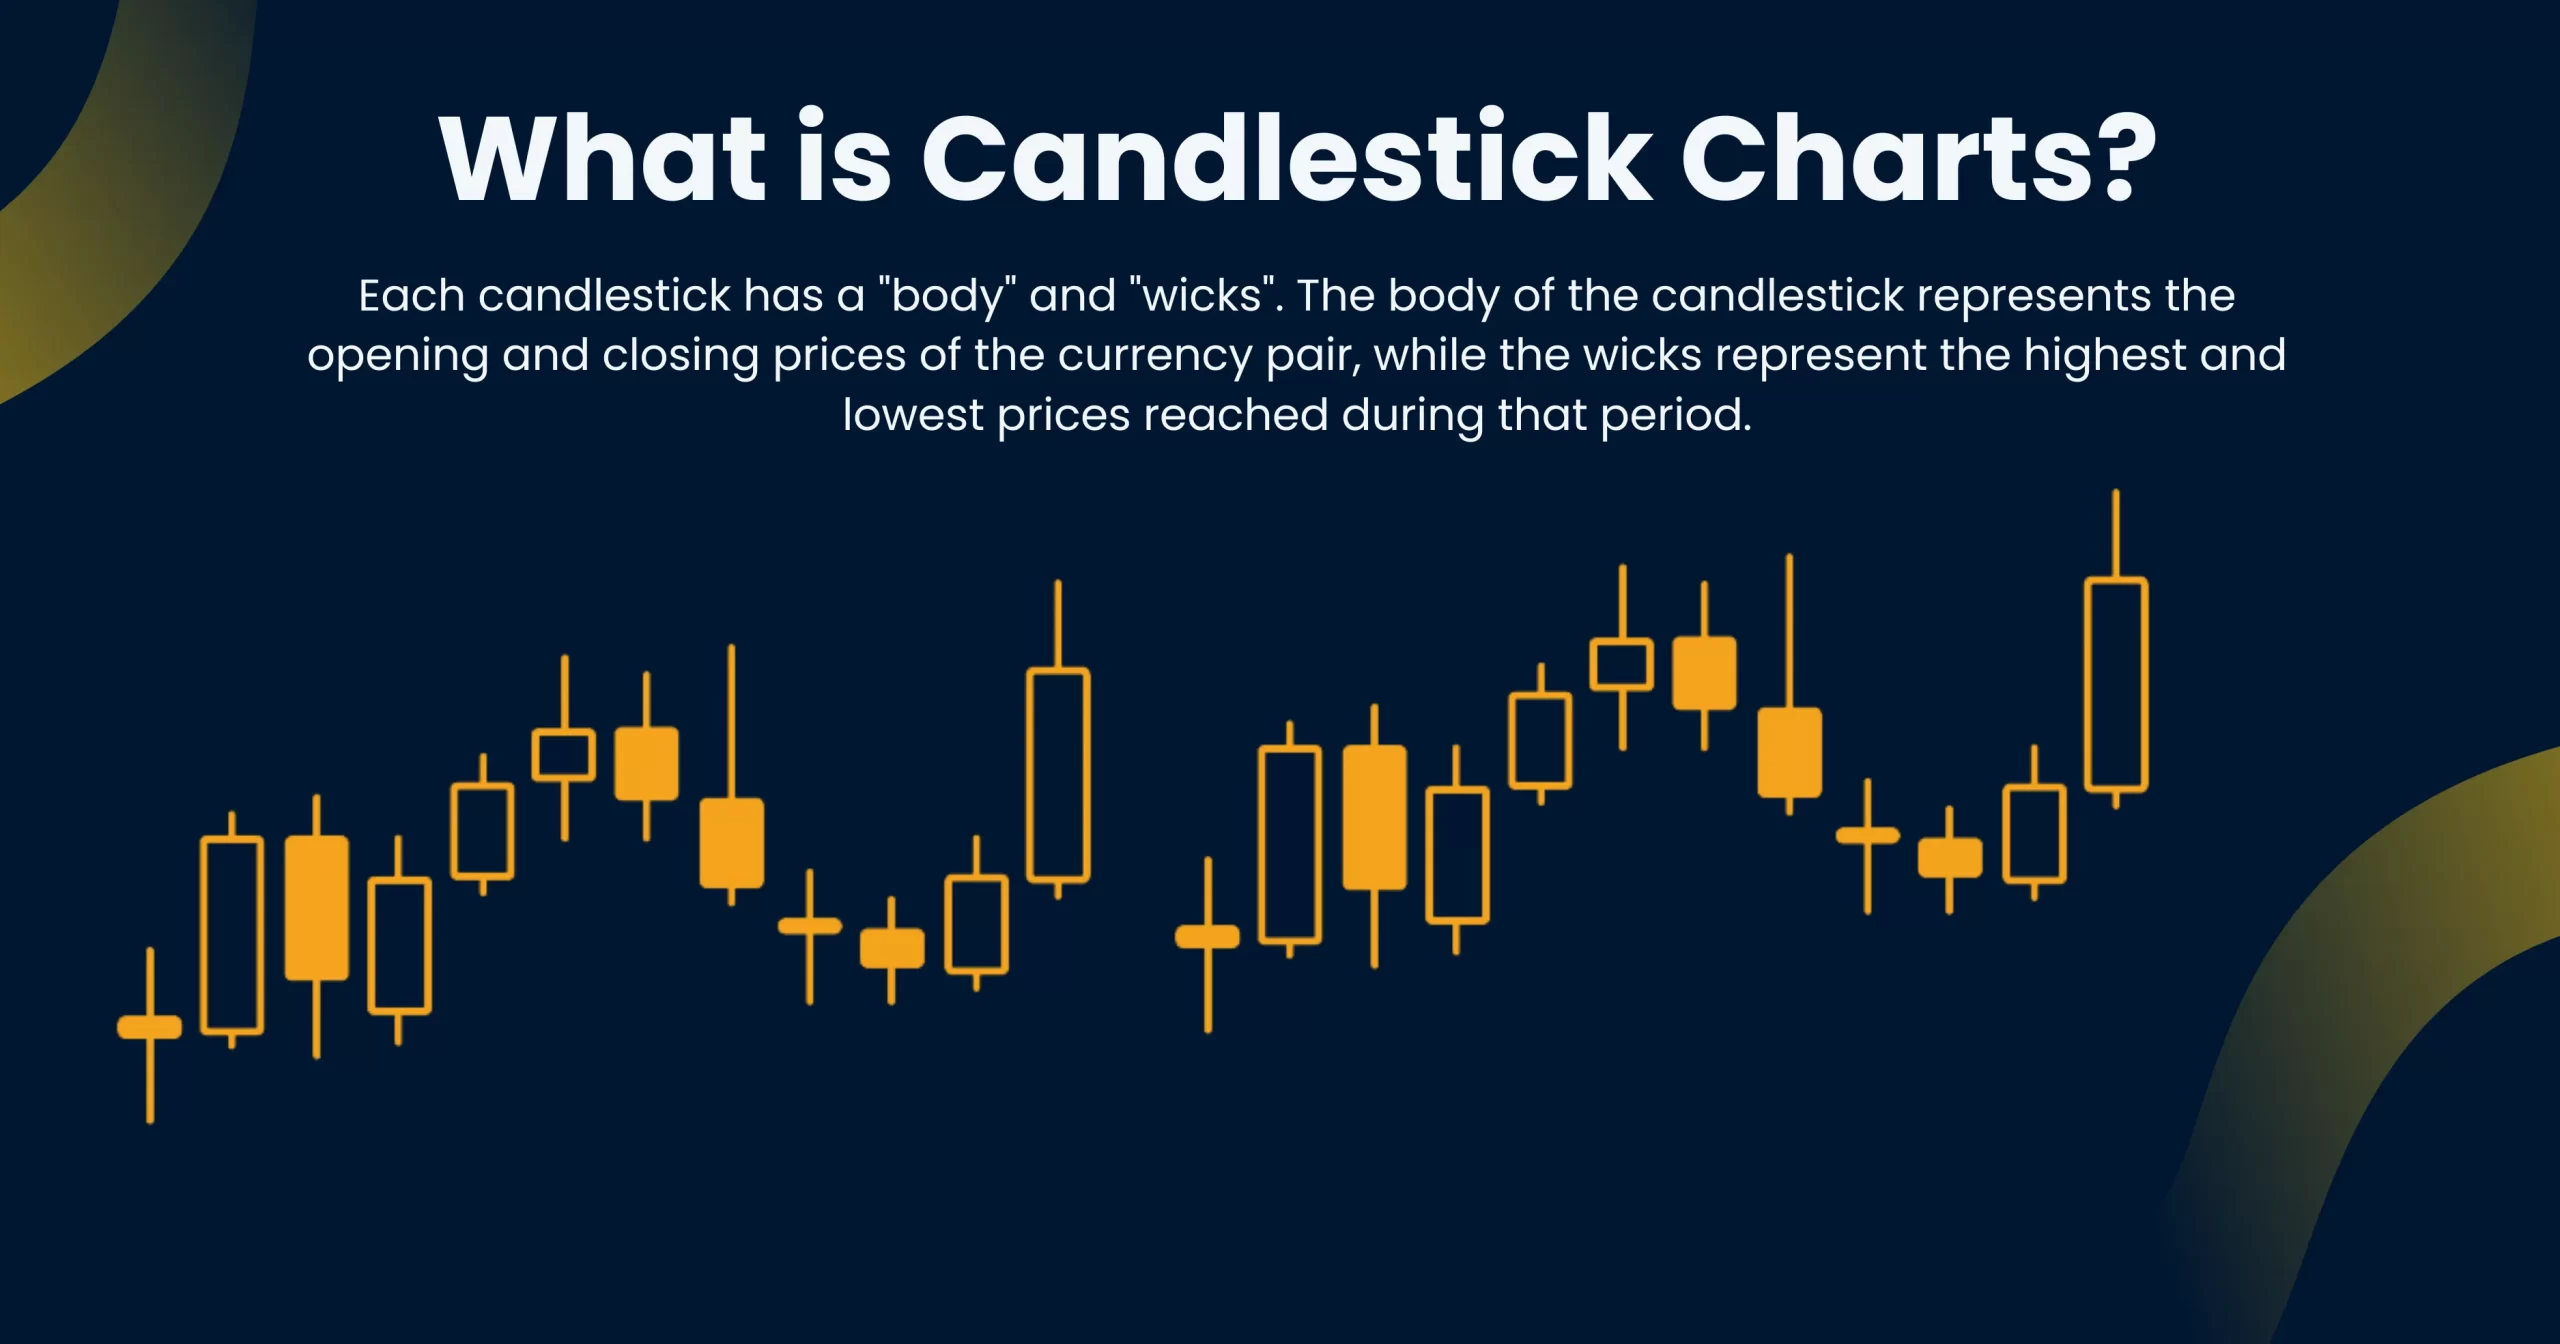
- Candlestick Charts: the third chart type that we want to discuss here are candlestick charts. As the name suggests, these charts are made from candles. Each candle helps represent the opening, closing, high and low prices in the time period, which is also usually one day. But candles also have wicks or shadows which can provide even more valuable information about which way prices are leaning toward.

Key Technical Indicators and Tools
The crux of technical analysis are the tools that are used to carry out the analysis itself. These tools are represented in the form of formulas and methods of obtaining and interpreting price data known as technical indicators. While there are countless indicators out there and users can even develop their own custom indicator, here we want to present you with a list of the most important technical indicators:
- Moving Averages (MA)
Moving averages are among the most popular and widely applied technical indicators. As the name suggests, the way they work is by smoothing the price data to provide uses with an averaged line representing price change. Because of their average nature, they can also help users detect the direction of the price trend.
Furthermore, moving averages can also be useful to traders in that they can help them detect reversals, and possible support and resistance lines in addition to trends. While there are many different moving averages, these are among the most well-known:
- Simple Moving Average (SMA): this is the simplest kind of moving averages, and shows an averaged-out line of prices over a certain period of time, such as 30 days.
- Exponential Moving Average (EMA): the exponential moving average or EMA is also very similar to the SMA, but it is more sensitive to price changes, so it can provide more information.
- Relative Strength Index (RSI)
This indicator is among those that are known as oscillators, which means they oscillate or go back and forth between two extremes. The relative strength index is used to measure the speed and change of price movements. The two ranges of these oscillators are 0 and 100. The number that the RSI shows at any given moment represents whether the market is in overbought or oversold condition.
The way it is interpreted is that the figure for RSI either refers to overbought or oversold conditions. So, for example if the figure is above 70 it indicates an overbought condition and if the figure is below 30 then it indicates an oversold condition.
- Moving Average Convergence Divergence (MACD)
This indicator which is shortly referred to as MACD is a trend following indicator. Of course, it relates to converging or diverging lines that are used to indicate whether the market is bullish or bearish. The lines that are used in the composition of a moving average convergence divergence are a signal line and a histogram. So, we calculate this indicator with respect to the MACD line with these lines. When the MACD line goes above the signal line the market is bullish and when it goes below then it is a bearish signal.
- Bollinger Bands
Another quite well-known indicator is the Bollinger Bands. This indicator is used to measure the volatility of the market. There are three bands or lines in the composition of this indicator. The middle line is a simple moving average or SMA and then there are two lines above and below this SMA which is each one standard deviation away from it. Now when the SMA is closer to the upper band, then it indicates that the market is overbought and there is potential for a bearish reversal. On the other hand, when the SMA is closer to the lower band, then it indicates that the market is oversold and there is the possibility for a bullish reversal.
- Support and Resistance
There are two other very straightforward but crucially important notions used in many indicators in technical analysis which are the support and resistance lines. The support line represents the lowest prices that can potentially plummet before a possible reversal toward bullish areas. On the other hand, the resistance line is the upper threshold or the highest prices can go at the given moment through pressure from bulls before it is possibly headed down.
Time Frames in Technical Analysis
Another important factor that plays into how we use and implement technical analysis are the time frames in forex trading. There are various time frames which range from the shortest term possible to much longer-term frames. These time frames are used to define the overall trading style used in forex trading. They are as follows:
- Scalping: these are the shortest time frames, such as 1-minute or 5-minute
- Day Trading: these are shorter time frames, like 15-minute, 30-minute, or 1-hour
- Swing Trading: these would be medium range time frames, such as 4-hour or daily
- Position Trading: these are the longest time frames, such as weekly or monthly
Conclusion
In forex trading, technical analysis is the most powerful method to analyze price movements and obtain highly valuable information about possible and potential future patterns that might occur. We then take this insight and use them to make decisions with respect to the positions that we want to open in the market. There are many different technical indicators that are used as part of the overall technical analysis approach in financial markets. In this article we took a basic and fundamental look at what technical analysis is, how it works, and some of the most widely implemented technical indicators.
